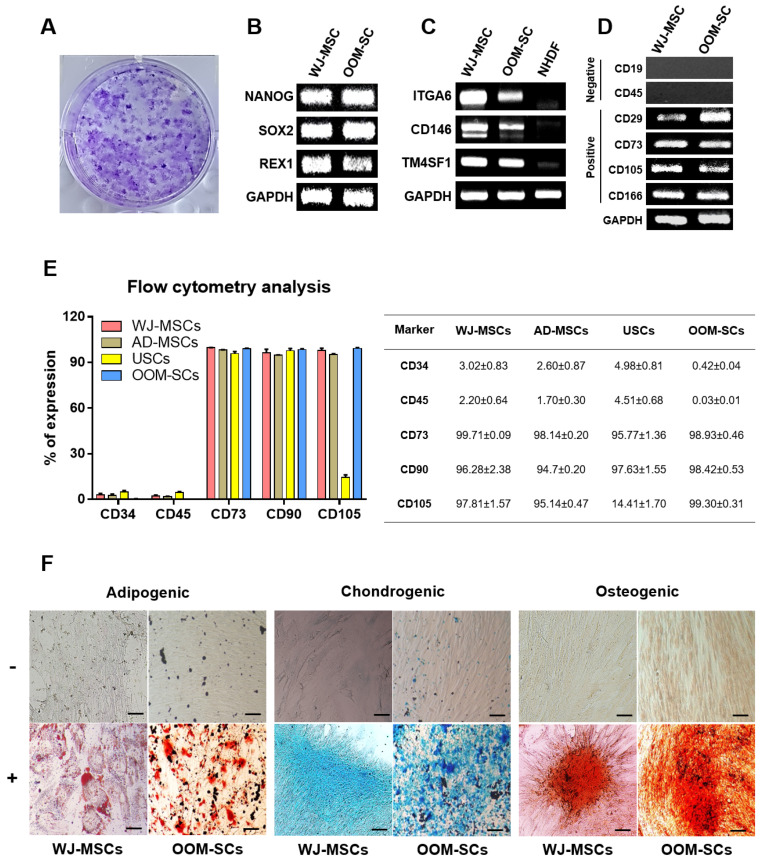
Figure 2.
Verification of OOM-SCs Characteristics. (A) Microscopic images depict the CFU of OOM-SCs that were visualized with 0.15% crystal violet solution after two weeks of culture. Images of the stained colonies were captured using phase-contrast microscopy. (B) RT-PCR results of the expression of the stemness markers Nanog, Sox2, and Rex1 in comparison with those of WJ-MSCs. GAPDH was used as a housekeeping gene. (C) RT-PCR results of specific markers, including ITGA6, CD146, and TM4SF1, distinguish between multipotent MSCs and NHDFs. These genes are only expressed in multipotent MSCs. (D) RT-PCR data for the expression levels of the surface markers of the isolated OOM-SCs compared with those of WJ-MSCs. These markers included the negatively (CD19 and CD45) and positively (CD73, CD105, and CD166) expressed markers. (E) FACS analysis for confirming the expression of the negative markers CD34 and CD45 and positive markers CD73, CD90, and CD105 for OOM-SCs, compared with those of WJ-MSCs. FACS results are summarized in the table (right panel), and all results are presented in percentages. (F) Microscopic images of adipogenic, chondrogenic, and osteogenic differentiation were evaluated by Oil Red, Alcian Blue, and Alizarin Red S staining, respectively. The upper and lower panels represent undifferentiated and differentiated cells, respectively. Scale bar = 200 μm.

