Figure 3.
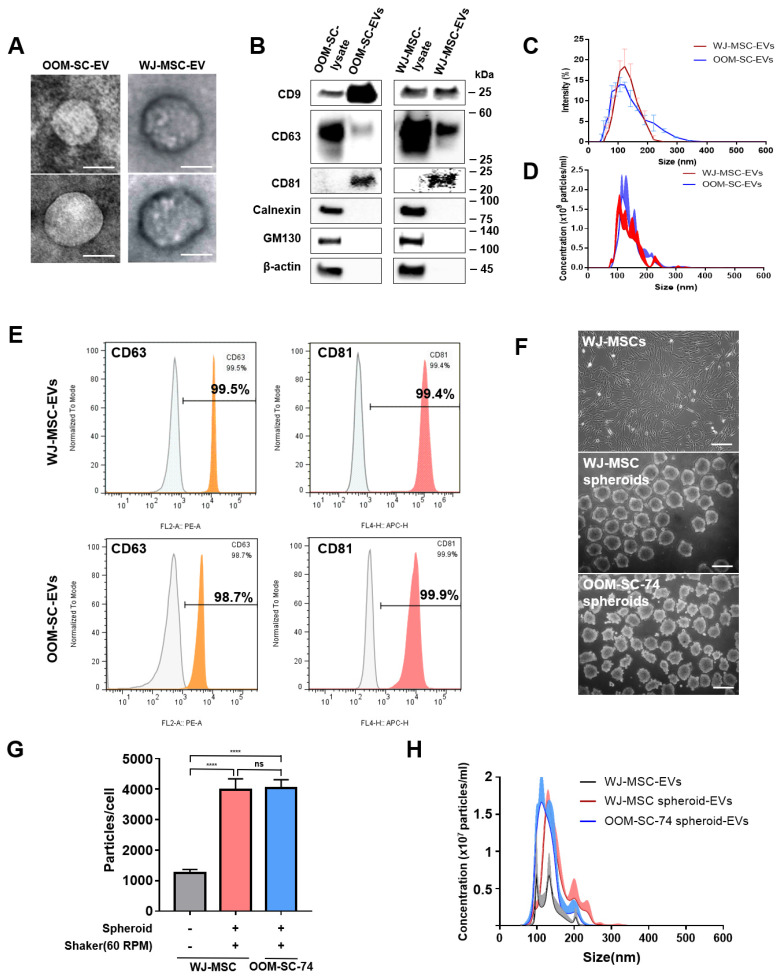
Characterization of OOM-SC-EVs. (A) TEM images of EVs showing cup- or sphere-shaped morphology. TEM analysis was performed at 80 kV. Scale bar = 100 nm. (B) Characterization of the expression levels of the EV-associated positive surface markers, including CD9, CD63, CD81, calnexin, and GM130, via immunoblotting. We used 3 µg of EVs for the immunoblotting analysis. The protein expression levels of the EV markers were compared with those of the whole cell lysate. (C) Dynamic light scattering analysis of EVs sizes. The average diameter of the purified EVs was of a size range of 90 to 120 nm. (D) Nanoparticle tracking analyzer NS300 for counting EV numbers. EVs concentrations were 1.66 × 10¹⁰ particles/mL for OOM-SC-EVs and 1.5 × 10¹⁰ particles/mL for WJ-MSC-EVs. (E) FACS analysis confirmed the expression of EV-associated markers, namely CD63 and CD81. (F) Phase-contrast microscopic pictures of WJ-MSCs monolayer and spheroids of WJ-MSCs and OOM-SCs (OOM-SC-74). For spheroid culture, WJ-MSCs and OOM-SCs were seeded onto F127 -coated AggreWell 400TM plates for 24 h for EB formation. Then, EBs were transferred to the ORS at 60 rpm for two days. EVs were isolated from both spheroids and the monolayer simultaneously. Scale bar = 200 μm. (G,H) Nanoparticle tracking analyzer NS300 for counting EV numbers in monolayer and spheroids. We detected 1246 particles/cell in WJ-MSCs monolayer, whereas EVs yield from WJ-MSCs and OOM-SCs spheroids were 3984 particles/cell and 4033 particles/cell, respectively. Data shown in Figure 3G are presented as mean ± SD. Statistical significance was determined using One-way ANOVA: **** p < 0.0001, ns; not significant.

