Figure 4.
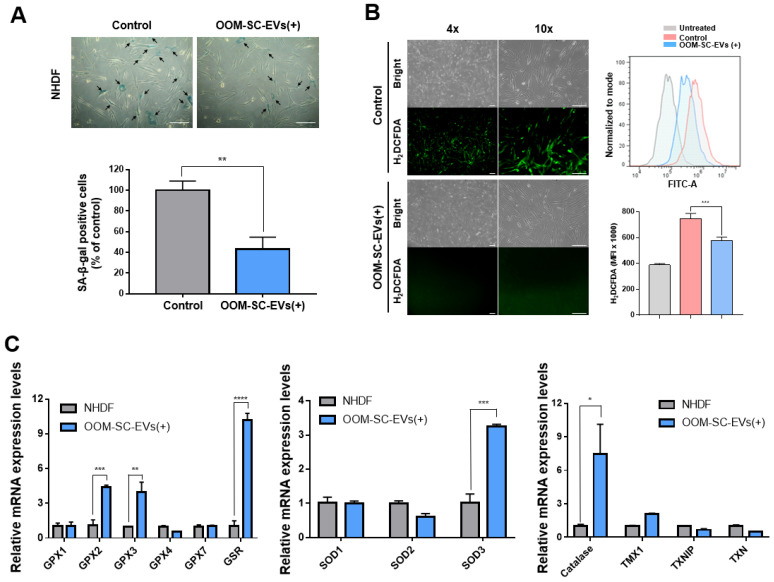
OOM-SC-EVs alleviate senescence-associated changes and modulate ROS generation. (A) SA-βgal assay showing a significant reduction of SA-βgal-positive cells after OOM-SC-EV treatment. SA-βgal-positive cells are stained blue. The lower panel graphical data represents the number of SA-βgal-positive cells shown in the upper panel, shown as a percentage of that of the control cells (late passage NHDF). Data are presented as mean ± SD. Statistical significance was determined using Two-tailed t test: ** p < 0.01. Scale bar = 200 µm. (B) Mitigation of ROS generation in OOM-SC-EV-treated late passage NHDF cells. ROS signals were detected via incubation in a 10 μM H2DCFDA solution for 30 min at 37 °C, followed by observation using a fluorescence microscope. The left panel shows the visualization of ROS green signals using the fluorescent microscope, while the right panels show the FACS-mediated quantitative analysis of ROS generation. The left panel shows the visualization of ROS green signals using the fluorescent microscope, while the right panel shows the FACS-mediated quantitative analysis of ROS generation. Data are presented as mean ± SD. Statistical significance was determined using One-way ANOVA: *** p < 0.001. Scale bar = 200 μm. (C) RT-PCR analysis of the expression levels of antioxidant genes in OOM-SC-EV-treated cells. OOM-SC-EVs significantly increased the expression levels of the antioxidant genes GPX2, GPX3, GSR, SOD3, and catalase. Data are presented as mean ± SD. Statistical significance was determined using Two-tailed t test: * p < 0.05, ** p < 0.01, *** p < 0.001, and **** p < 0.0001.

