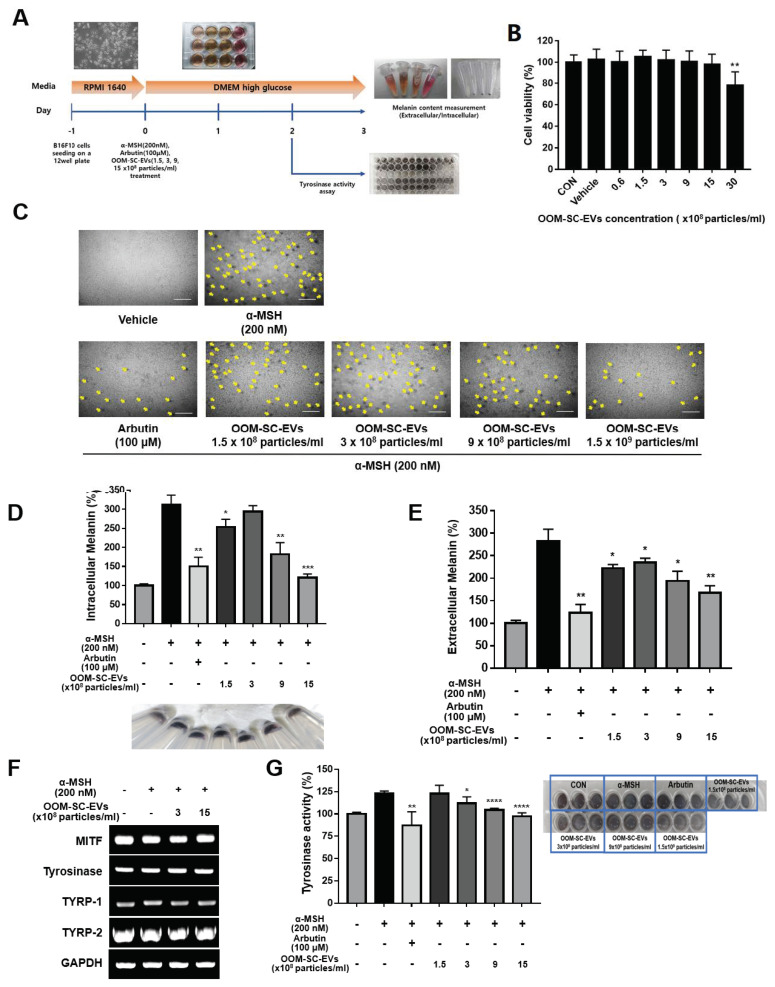
Figure 5.
Modulatory effects of OOM-SC-EVs on melanin synthesis and tyrosinase activity. (A) A representative scheme elucidates the experimental schedule for evaluating the effects of OOM-SC-EVs on melanin synthesis and tyrosinase activity. In this experiment, we cultured B16F10 melanoma cells using a growth medium (RPMI 1640). The cells were then exposed to OOM-SC-EVs in a dose-dependent manner in combination with arbutin (melanin synthesis inhibitor) and α-MSH (melanin synthesis activator) in DMEM high glucose medium. Tyrosine activity and melanin content were measured after OOM-SC-EV and inhibitor treatments on day 2 and day 3, respectively. (B) Effect of concentration-dependent exposure of OOM-SC-EVs on the viability of B16F10 cells. B16F10 cells were plated at 3 × 10³ cells/well in a 96-well plate and maintained in serum-free RPMI medium overnight. The cells were then exposed to OOM-SC-EVs in a concentration-dependent manner (0.6, 1.5, 3, 9, 15, and 30 × 108 particles/mL) for 48 h. Subsequently, we added 10 μL of CCK-8 solution/well (Dojindo, CK04-05), followed by incubation for 2 h with protection from light. Absorbance was measured at 450 nm using a Bio-RAD x-MarkTM spectrophotometer. (C) Microscopic images showing the dose-dependent inhibitory action of OOM-SC-EVs on α-MSH-mediated melanosome formation compared with that of the melanin synthesis-suppression chemical arbutin. The formation of melanosomes is indicated by a yellow arrow. OOM-SC-EVs showed a dose-dependent suppression of melanosome formation. Scale bar = 100 µm. (D) Measurement of intracellular melanin levels after treatment with OOM-SC-EVs. Significant inhibition of melanin synthesis by OOM-SC-EVs was detected at 9 and 15 × 108 particles/mL, similar to the inhibitory effect of arbutin. The lower panel showing the qualitative inhibitory action of OOM-SC-EVs against melanosome formation was visualized in cells via a change in the color of the cell pellets. (E) Estimation of the effect of OOM-SC-EVs on the suppression of α-MSH-mediated induction of extracellular melanin levels compared to that of arbutin. (F) RT-PCR data for measuring changes in the expression levels of melanin synthesis-associated genes, including tyrosine synthesis-related genes, such as MITF, tyrosinase, TYRP-1, and TYRP-2, after treatment with OOM-SC-EVs in combination with α-MSH. GAPDH was used as a housekeeping gene. (G) Measurement of tyrosinase activity after treatment with various concentrations of OOM-SC-EVs compared with those after treatment with arbutin and α-MSH for 48 h. Subsequently, cells were harvested, permeabilized, frozen and thawed, and centrifuged. For the tyrosine activity assay, the supernatant was mixed with 10 mM L-DOPA in a 96-well plate and incubated for 1 h at 37 °C. The activity was measured at 405 nm using a spectrophotometer and represented as a percentage of the control value. The lower panel shows the visual analysis of tyrosinase activity in a 96-well plate. Data shown in Figure 5B,D,E,G are presented as mean ± SD. Statistical significance was determined in Figure 5B,D,E,G using Two-tailed t test: * p < 0.05, ** p < 0.01 *** p < 0.001, and **** p < 0.0001.

