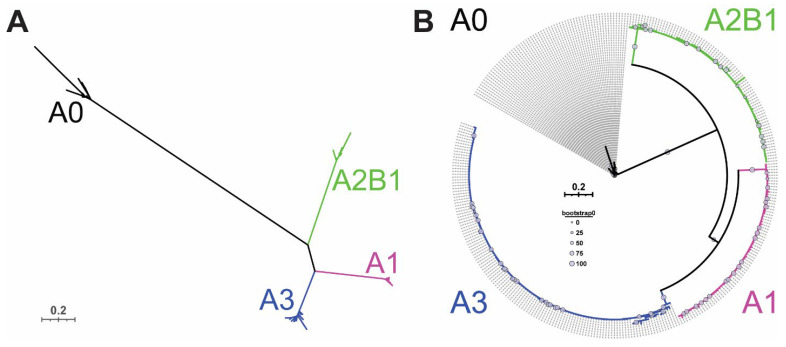
Figure 2.
Updated analysis of mammalian hnRNP A/B protein sequences demonstrates their evolutionary relatedness. Sequences were drawn from the NCBI Orthologs database for each hnRNP A/B family protein, and manually depleted of Low-Quality protein sequences. Different isoforms of each protein within a species were retained. Sequences were then aligned using a Mafft multiple sequence alignment program [27], identical sequences were manually removed, and ambiguous sites were masked using Alistat [28], before generating maximum likelihood trees with VT + F + R4 model in the IQTree program [29]. Original inputs: A0, n = 140; A1, n = 259; A2/B1, n = 428; A3, n = 352. (A) Unrooted phylogram of mammalian hnRNP A/B family proteins, coloured by protein of origin. Scale bar indicates 0.2 amino acid changes per site. (B) Circular tree (polar plot) representation of mammalian hnRNP A/B family proteins with A0 as outgroup. Each dotted line indicates a unique sequence; duplicate sequences have been removed from the plot. Grey circles indicate bootstrap confidence values.

