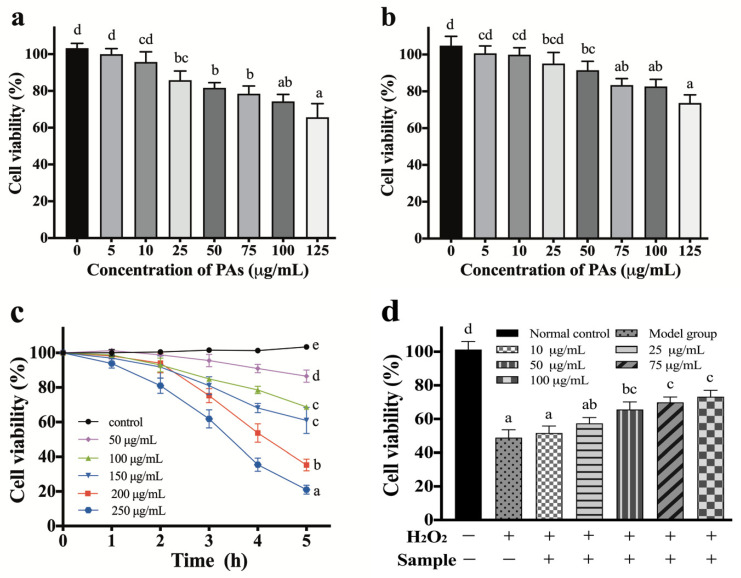
Figure 7.
Cytotoxicity analysis of PKLPs by using various cells. (a) Caco-2 cells; (b) HepG-2 cells; (c) cell viability effect by various concentration of H2O2 (0–250 μg/mL); and (d) antioxidant potential of PKLPs on the H2O2-induced Caco-2 cells model after 24 h of incubation. Mean ± SD with different alphabet superscripts within the same column and analytical parameter indicate that values differ significantly (p < 0.05).

