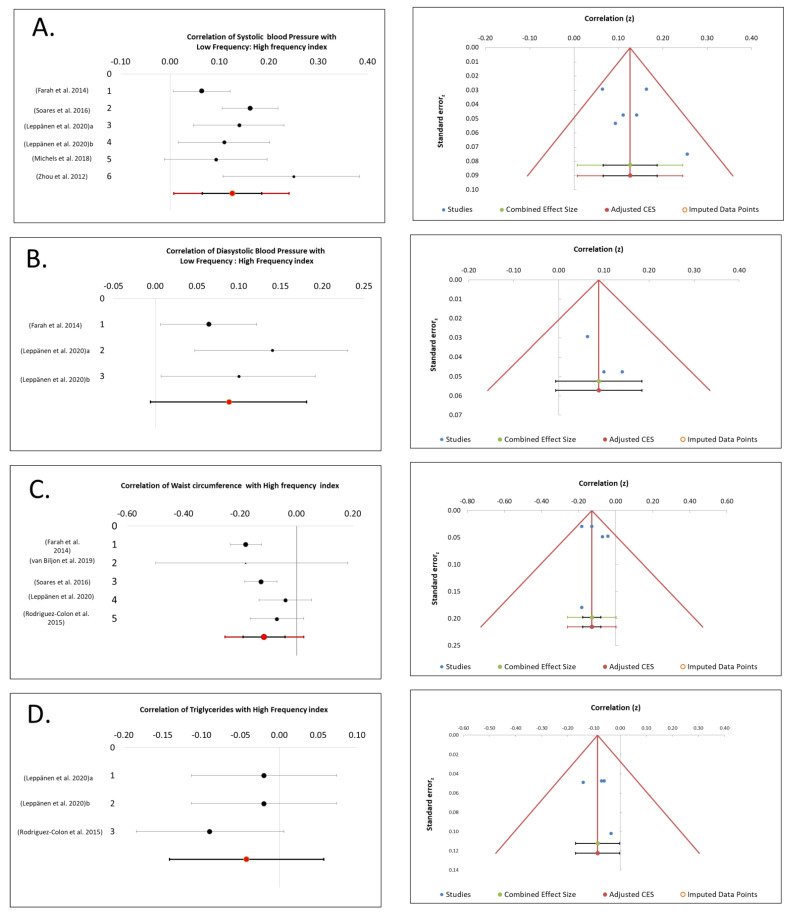
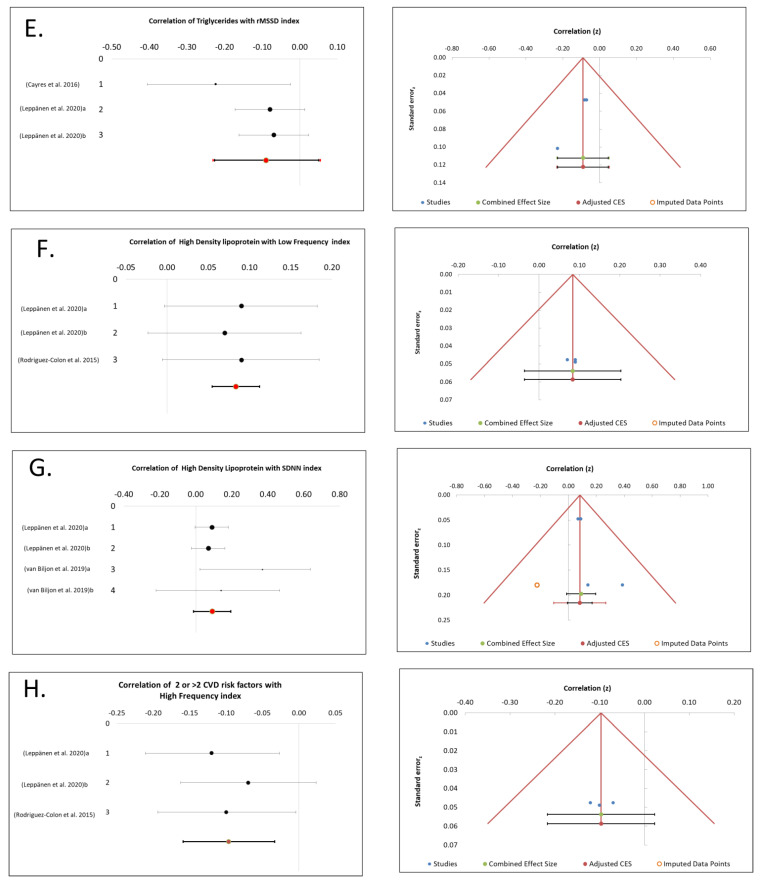
Figure 2.
(A–I) are Forest plots and Funnel plots of pooled significant correlations between cardio metabolic risk factors and heart rate variabilty indices along with its publication bias, respectively including (A). (A). Correlation of systolic blood pressure with low frequency: high frequency index; (B). Correlation of diastolic blood pressure with low frequency: high frequency index; (C). Correlation of waist circumference with high frequency index; (D). Correlation of Triglycerides with high frequency index; (E). Correlation of triglycerides with rMSSD index; (F). Correlation of high density lipoprotein with Low frequency index; G. Correlation of high density lipoprotein with SDNN index; (H). Correlation of 2 or >2 CVD risk factors with high frequency index; (I). Correlation of 2 or >2 CVD risk factors with low frequency index. All the correlations charts are accompanied by their Eggers test graph, rMSSD is mean square root of the sum of differences between mean time between two successive intervals, SDNN is standard deviation of the time between two successive intervals and CVD is cardio-vascular disease.


