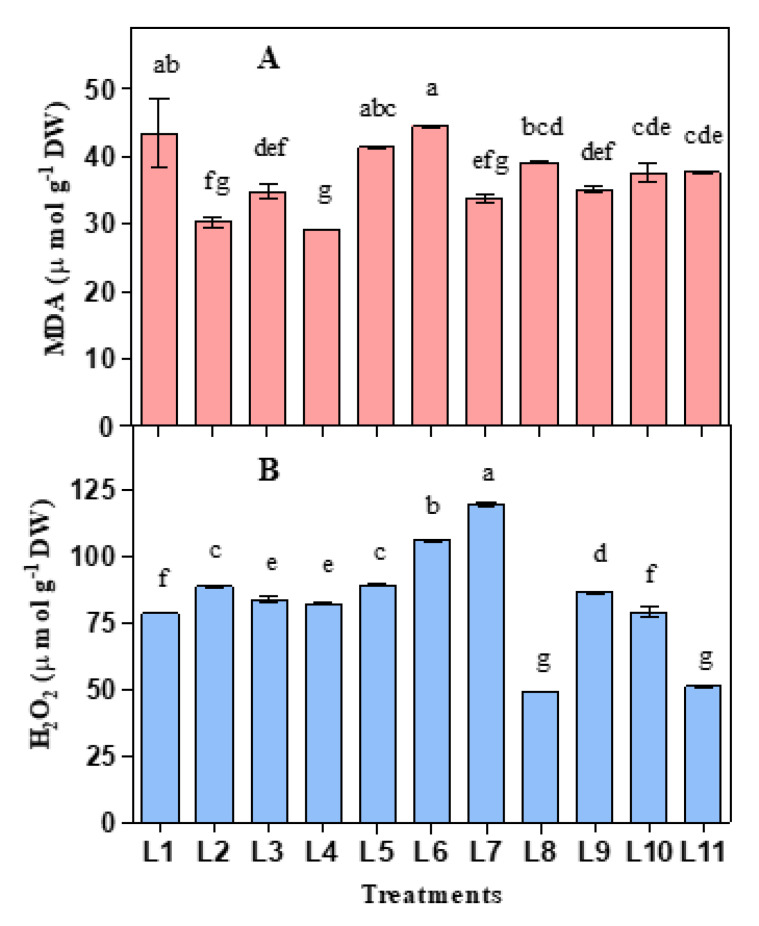
Figure 3.
Effect of 20 days exposure to different LED spectra on Lipid peroxidation (MDA) (A) and H2O2 (B) of hemp seedlings. Here and subsequent figures: L1, Natural light; L2, White; L3, R8:B2; L4, R7:B2:G1; L5, R7:B2:FR1; L6, R6:B2:G1:FR1; L7, R5:B2:W2:FR1; L8, R5:B2:G1:FR1:UV1; L9, R6:B2:FR1:UV1; L10, R4:B2:W2:FR1:UV1; L11, R2:B2:G2:W2:FR1:UV1. All treatments used a photosynthetic photon flux density of 300 µmol m−2 s−1. Vertical bars indicate mean ± SE of four replicates. Different letters indicate significant differences at p < 0.05.

