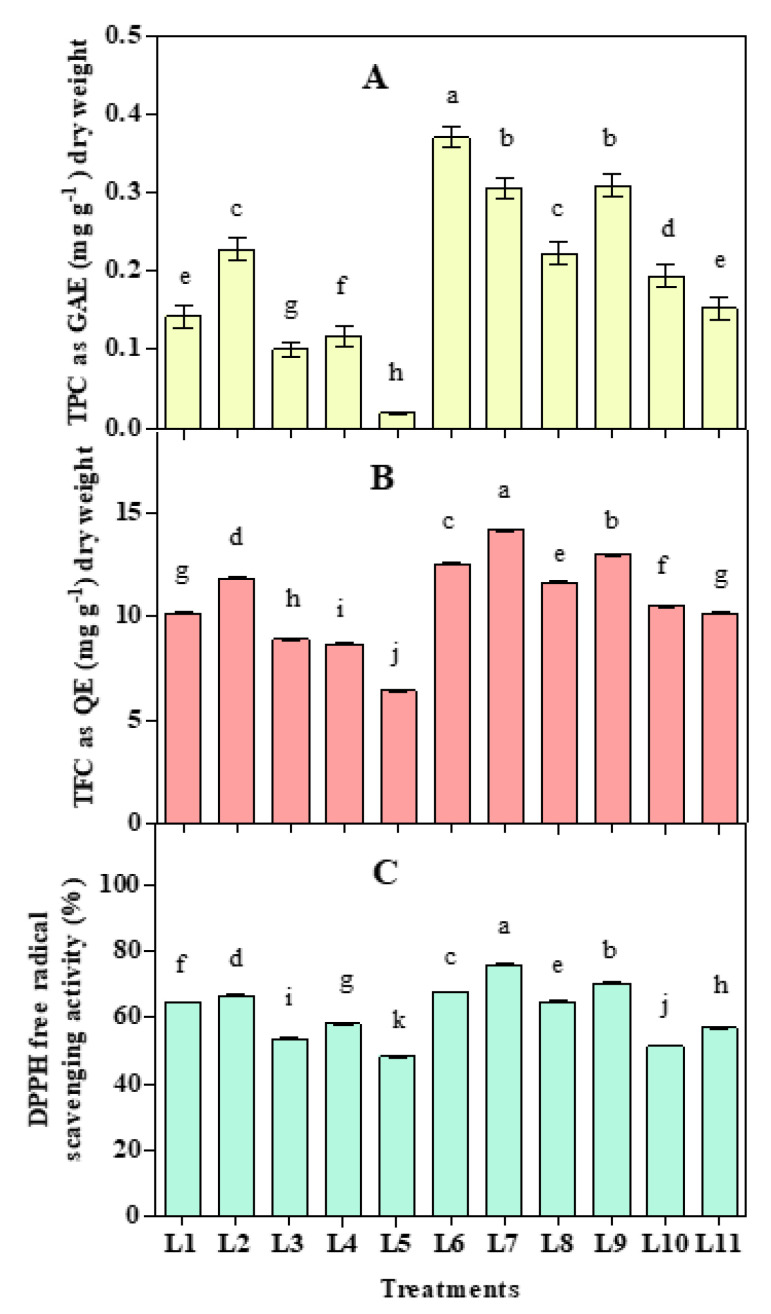
Figure 5.
Effect of 20 days exposure to different LED spectra on Total polyphenol (TPC) (A), Total flavonoid (TFC) (B), and DPPH radical scavenging activity (C) of hemp seedlings. Here and subsequent figures: L1, Natural light; L2, White; L3, R8:B2; L4, R7:B2:G1; L5, R7:B2:FR1; L6, R6:B2:G1:FR1; L7, R5:B2:W2:FR1; L8, R5:B2:G1:FR1:UV1; L9, R6:B2:FR1:UV1; L10, R4:B2:W2:FR1:UV1; L11, R2:B2:G2:W2:FR1:UV1. All treatments used a photosynthetic photon flux density of 300 µmol m−2 s−1. Vertical bars indicate mean ± SE of four replicates. Different letters indicate significant differences at p < 0.05.

