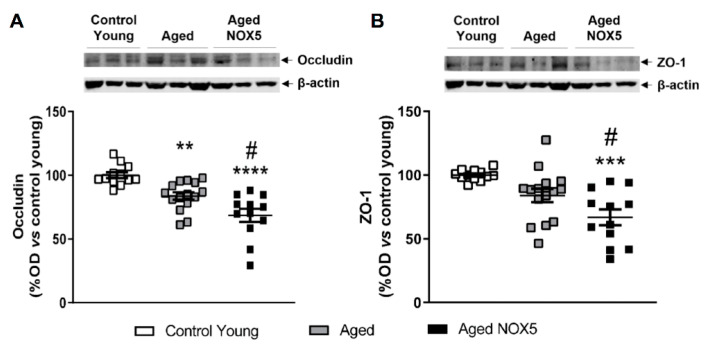
Figure 7.
Cerebral occludin and ZO-1 protein expression. Occludin, ZO-1 and β-actin representative immunoblots from mice brain tissue and their quantification. (A) Cerebral occludin protein levels expressed as a percentage of the optical density (% OD) in the aging mice vs. the Control Young group. ** p < 0.01, **** p < 0.0001 vs. Control Young and # p < 0.05 vs. Aged. (B) Cerebral ZO-1 protein levels expressed as a percentage of the optical density (% OD) in the aging mice vs. the Control Young group. ***p < 0.001 vs. Control Young and # p < 0.05 vs. Aged. n = 13–19. The results are expressed as the mean ± SEM. Control Young: young mice, Aged: CRE+/− aging mice and Aged NOX5: NOX5+/−CRE+/− aging mice.

