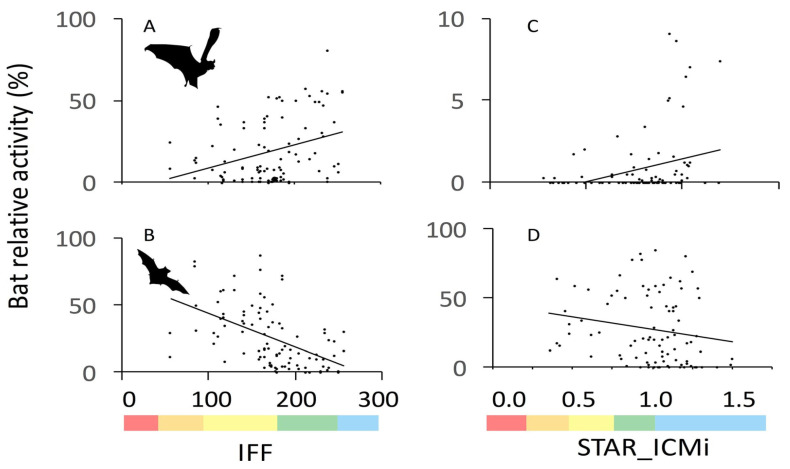
Figure 1.
In a study carried out in Italy, bat communities showed significant responses to river quality. The figure shows the relationship between % activity for groups of bat species and the two bioindication indices. (C) is a group characterised by similar echolocation calls made of two genera (Nyctalus and Eptesicus) which were not separated for the purpose of the study; (A), (B), and (D) were groups made by associating species that showed similar responses (“shopping basket” approach) to improve bioindication performances. (A) = Pipistrellus pipistrellus + Myotis emarginatus + M. nattereri + Nyctalus/Eptesicus serotinus + Barbastella barbastellus; (B) = Miniopterus schreibersii/Pipistrellus pygmaeus + P. kuhlii; (C) = Nyctalus/Eptesicus serotinus; and (D) = M. schreibersii/P. pygmaeus + M. daubentonii/capaccinii. The Fluvial Functionality Index (IFF) is shown on the left, while the macroinvertebrate-based STAR_ICMi index is on the right. River-quality ranges (increasing from left to right) associated to index values are shown below the plots as follows: red = bad, orange = poor, yellow = moderate, green = good, blue = excellent. Reprinted from [18]. Copyright (2018), with permission from Elsevier.

