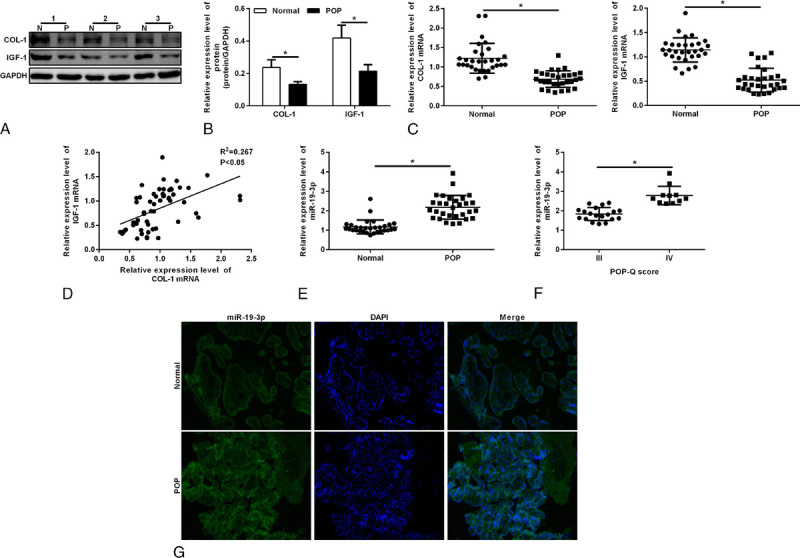
FIGURE 1.

A, Protein expressions of COL-1 and IGF-1 in the POP group and control group. Protein was qualified by means of Western blotting. P stands for the POP group; and N, for the normal group. B, Densitometric analysis for COL-1 and IGF-1. Bars, mean ± SD. *P < 0.05. C, Quantitative reverse transcription-polymerase chain reaction was used for the determination of COL-1 mRNA expression and IGF-1 mRNA expression in the vaginal tissue of patients with POP and of the control group. D, The Pearson test revealed the relationship between the level of COL-1 mRNA and IGF-1 mRNA. E, Densitometric analysis for miR-19-3p expression in the vaginal tissue of patients with POP and the control group. F, Densitometric analysis for miR-19-3p expression in the degree III POP group and degree IV POP group. G, FISH staining was used to examine the expression of miR-19-3p. Nucleus was stained by DAPI. COL-1, collagen 1; IGF-1, insulin-like growth factor 1; mRNA, messenger RNA; POP, pelvic organ prolapse; POP-Q, pelvic organ prolapse quatitative.
