
FIGURE 6.
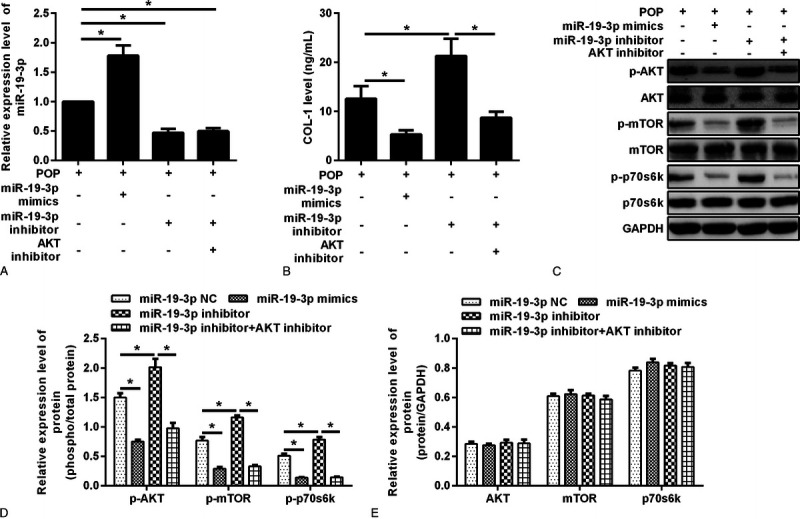
Fibroblasts were transfected with miR-19-3p NC, miR-19-3p mimic, miR-19-3p inhibitor, and miR-19-3p inhibitor + AKT inhibitor, respectively. A, The expression of miR-19-3p was detected by quantitative reverse transcription-polymerase chain reaction. *P < 0.05. B, Col-1 expression level was determined by enzyme-linked immunosorbent assay. P < 0.05. C, Western blot for AKT, mTOR, p70S6K, p-AKT, p-mTOR, and p-p70S6K in the 4 groups. D, Densitometric analysis for p-AKT, p-mTOR, and p-p70S6K in these groups. *P < 0.05. E, Densitometric analysis for AKT, mTOR, and p70S6K in these groups. * P < 0.05. mTOR, mammalian target of rapamycin; NC, negative control.