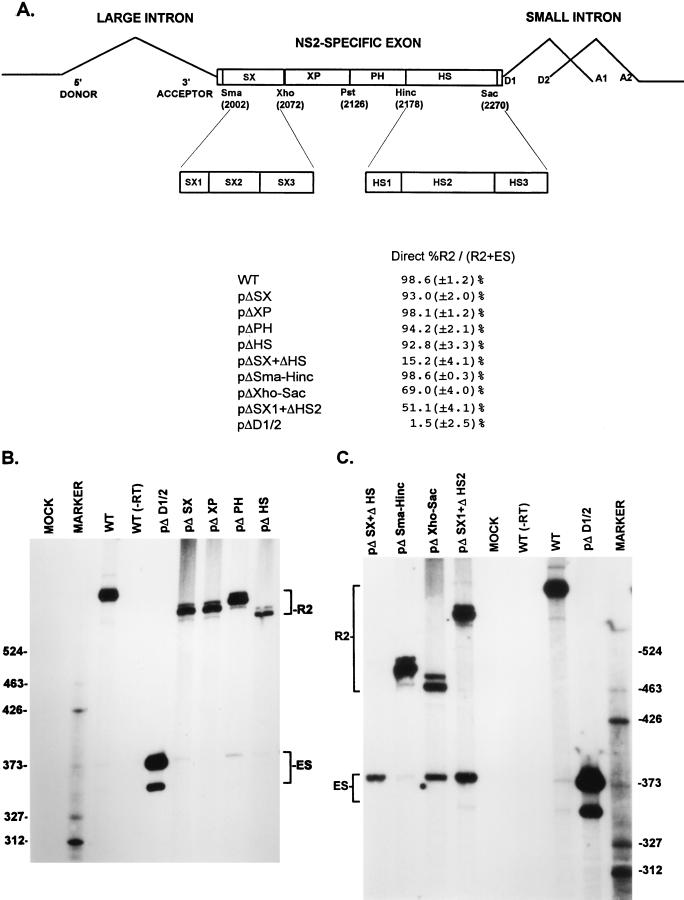
FIG. 2.
A bipartite enhancer within the NS2-specific exon is required for inclusion of this exon in mature spliced mRNA. (A) The restriction sites within the NS2-specific exon (SmaI, XhoI, PstI, HincII, and SacI) which divide the exon into four regions (SX, XP, PH, and HS) and were used to generate the different exon deletion mutants are indicated (ΔSX, for example, is a deletion between the SmaI and XhoI sites [see the text]). The SX1 to SX3 and HS1 to HS3 regions extend between the following nucleotide positions: SX1, nt 2002 to 2025; SX2, nt 2019 to 2052; SX3, nt 2050 to 2109; HS1, nt 2177 to 2196; HS2, nt 2196 to 2253; HS3, nt 2252 to 2270 (MVM nucleotide numbers as in reference 1). Quantitations of the direct percent R2/(R2+ES) ratio obtained by RT-PCR analysis for various mutants are also shown. All the values are the average of at least three separate experiments. Standard deviations are indicated in parentheses. ES values for pΔD1/2 are shown for comparison; the mutation is shown in Fig. 5A. (B) RT-PCR analysis of RNA generated by wild-type MVM (WT), mutants (described in the text), or mock transfected, as designated at the top of each lane. Samples were run on a 6% acrylamide—urea gel. pΔD1/2 was used as a control for amplification of the ES. WT(−RT) is a control reaction with wild-type RNA but excluding reverse transcriptase. An RNase protection analysis, with probe B, of RNA generated by the wild type was used as a marker (MARKER; the sizes of the marker bands are shown on the left) for the sizes of the RT-PCR-amplified bands. Wild-type RNA generated a 658-nt amplified R2 product, while RNA generated by the mutants showed R2 products of sizes consistent with the sizes of the deletions in these mutants. As explained in the legend to Fig. 5D, two kinds of amplified ES, using either A1 or A2, were observed. (C) RT-PCR analysis of RNA generated by wild-type MVM (WT), mutants (described in the text), or mock transfected, as designated at the top of each lane. Samples were run on a 6% acrylamide–urea gel. pΔD1/2 and WT(−RT) controls, and the marker (MARKER; the sizes of the marker bands are shown on the right for the sizes of the RT-PCR-amplified bands) are as in panel B. Wild-type RNA generated a 658-nt amplified R2 product, while RNA generated by the mutants showed R2 products of sizes consistent with the sizes of the deletions in these mutants. As explained in the legend to Fig. 5D, two kinds of amplified ES using either A1 or A2 were observed.

