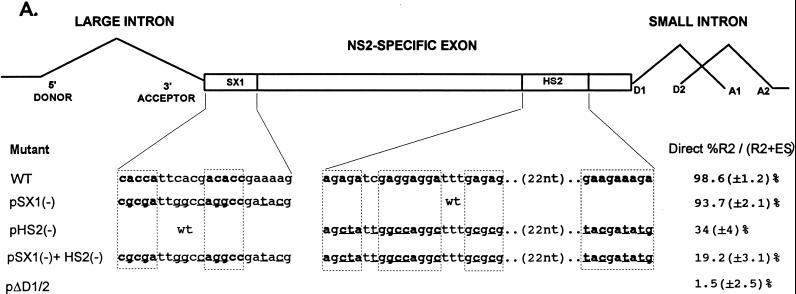
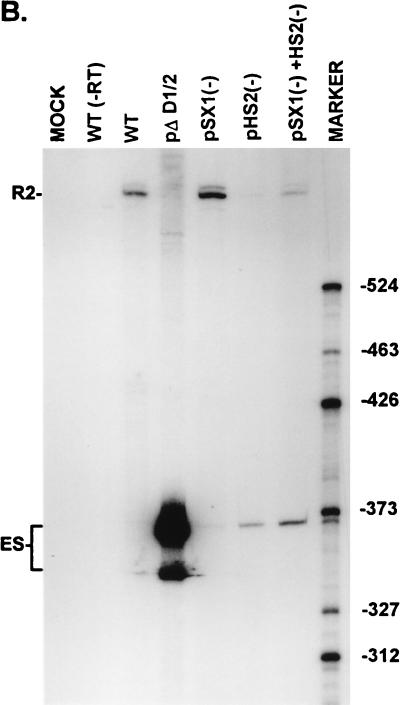
FIG. 3.
Point mutations within the bipartite enhancer result in exon skipping. (A) The sequences of the wild-type and mutant SX1 and HS2 regions are shown underneath their appropriate map positions (with deviations from the wild-type sequence underlined), together with quantitations of the direct percent R2/(R2+ES) ratio obtained by RT-PCR analysis for each mutant. The CA-rich sequences in the SX1 region and the purine-rich sequences in the HS2 region are boxed and in boldface type. All the values are the average of at least three separate experiments. Standard deviations are indicated in parentheses. ES values for pΔD1/2 are shown for comparison; the mutation is shown in Fig. 5A. wt, wild type sequence. (B) RT-PCR analysis of RNA generated by wild-type MVM (WT), mutants (described in the text), or mock transfected, as designated at the top of each lane. Samples were run on a 6% acrylamide–urea gel. pΔD1/2 and WT(−RT) controls and MARKER (the sizes of the marker bands are shown on the right) are as described in the legend to Fig. 2B. RNAs generated by either the wild type or the point mutants showed a 658-nt amplified R2 product. As explained in the legend to Fig. 5D, two kinds of amplified ES, using either A1 or A2, were observed.


