FIG. 4.
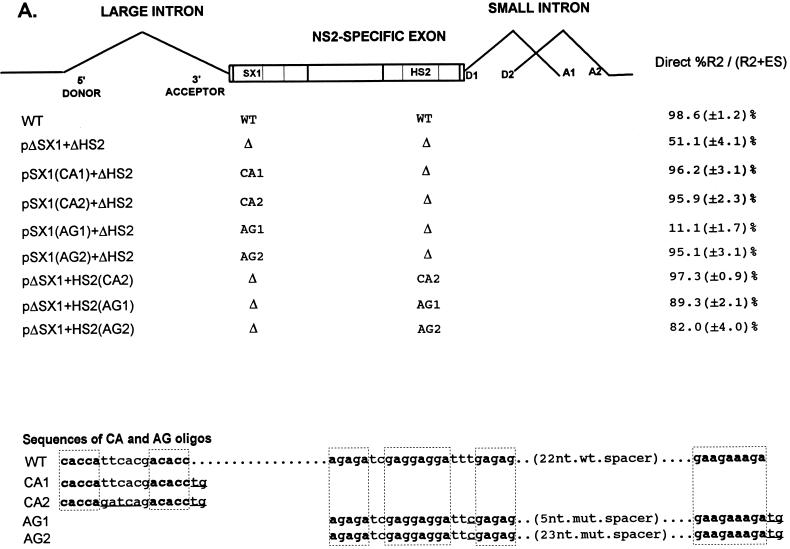
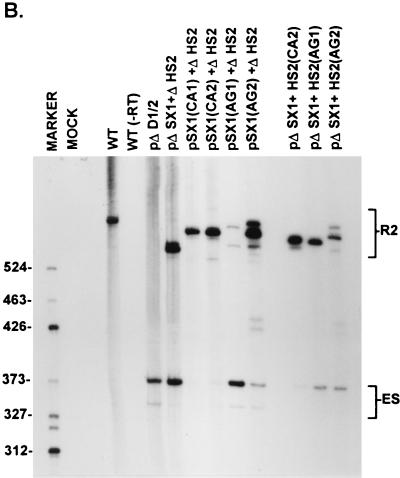
A CA-rich element and a purine-rich element together constitute the bipartite enhancer of the NS2-specific exon. (A) The sequences of the CA-rich and AG-rich oligonucleotides that were tested (deviations from the wild-type sequence are underlined; the sequences of the wild-type spacer in HS1 or the mutant spacers in AG1 and AG2 are described in Materials and Methods), and the positions at which they were replaced into pΔSX1+ΔHS2 are indicated (see the text for details). The CA-rich sequences in the SX1 region and the purine-rich sequences in the HS2 region are boxed and in boldface type. Quantitations of the direct percent R2/(R2+ES) ratio obtained by RT-PCR analysis for each mutant are also shown. All the values are the average of at least three separate experiments. Standard deviations are indicated in parentheses. WT, wild-type sequence. Δ, deletion. (B) RT-PCR analysis of RNA generated by wild-type MVM (WT), mutants (described in the text), or mock transfected, as designated at the top of each lane. Samples were run on a 6% acrylamide—urea gel. pΔD1/2 and WT(−RT) controls and MARKER (the sizes of the marker bands are shown on the left) are as described in the legend to Fig. 2B. RNA generated by WT showed a 658-nt amplified R2 product, while RNA generated by the mutants showed R2 products of sizes consistent with the sizes of the deletions and/or substitutions in these mutants. As explained in the legend to Fig. 5D, two kinds of amplified ES, using either A1 or A2, were observed.


