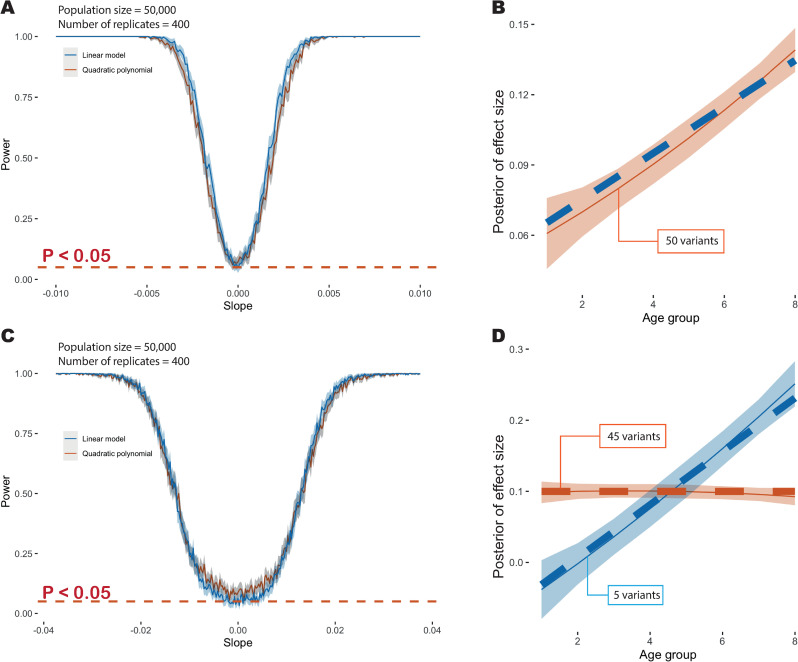
Fig 3. Overview of simulation results.
(A) Power at P ≤ 0.05 to detect deviation from age-homogeneity as a function of slope in a model where effect sizes change linearly with age. The blue line indicates the point estimate when using a linear model to fit, the red line indicates the point estimate with a quadratic polynomial model and the grey shading indicates the 95% confidence interval. (B) Example showing the age-profile under which data are simulated (dashed blue line) and the inferred age profile (dashed red line) and 95% credible interval (red shading). (C) Power at P ≤ 0.05 to detect multiple age profiles in a simulation where 90% of variants have a time-invariant profile and 10% have an effect size that increases with age. The solid blue line indicates power when fitting a linear model and the solid red line indicates power when fitting a quadratic model. The dashed red line indicates the nominal significance threshold. Note the change in x-axis scale compared to Fig 2A. (D) Example showing inferred age-profiles for the two components (mean posterior and 95% credible interval). Additional simulation details are provided in the S1 Supplemental Methods and S2 Fig.

