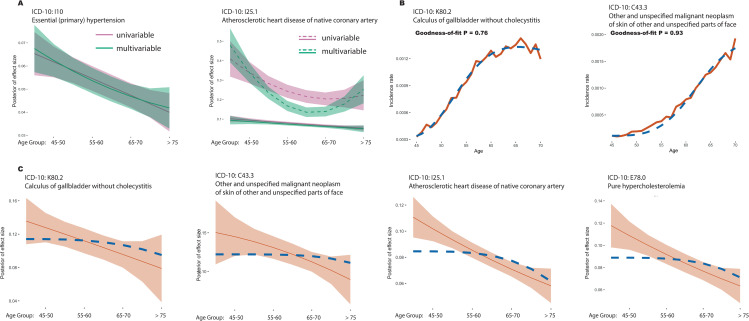
Fig 5. The impact of frailty on genetic risk profiles.
(A) Estimated age-profiles for genetic risk for I10 “essential (primary) hypertension” (left) and I25.1 “atherosclerotic heart disease of native coronary artery” (right) fitted under the univariable (purple) and multivariable (green) approaches. For I10, the solid line indicates the posterior mean and the shaded area the 95% credible interval; For I25.1, the solid and dashed lines indicate the means for the two clusters of variants. Comparisons for all diseases are shown in S10 Fig. (B) Estimated incidence by age for K80.2 “Calculus of gallbladder without cholecystitis” (left) and C44.3 “Other and unspecified malignant neoplasm of skin and unspecified parts of face” (right). The red solid line indicates the rate estimated from the UK Biobank (see S1 Supplemental Methods) and the dotted blue line indicates the fitted incidence curve from the parametric model. The P value indicates the Goodness-of-Fit test. Curves for all diseases are shown in S11 Fig. (C) Comparison of inferred genetic effect sizes (red curve) and those implied by the frailty parameters estimated from incidence rate within the UK Biobank (blue dashed curve).

