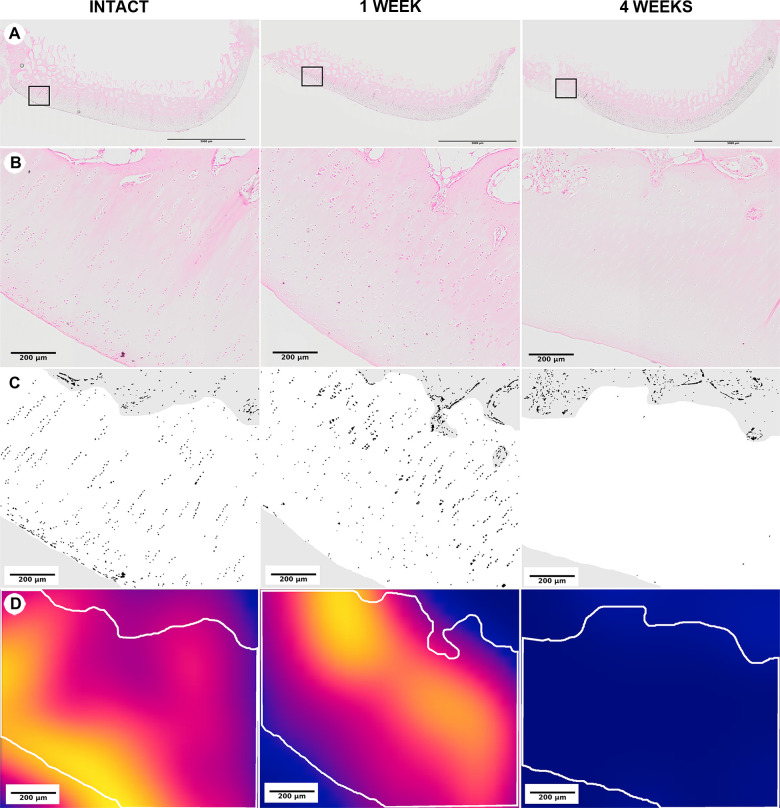
Fig 4. Medial femoral condyle articular cartilage irreversible cell injury and loss at 1- and 4 weeks following surgical induction of PTOA.
The magnifications shown in this figure were selected for illustrative purposes; all analyses were performed using a 20x objective. All sections are in the frontal plane and the area adjacent to the intercondylar notch is to the left of each figure. (Row A) Low magnification, H&E. Boxes indicate regions shown at higher magnification in Row B. (Row B) Higher magnification, H&E. Note the changes in chondrocyte distribution in areas articulating with the tibial spine at 1- and 4 weeks post-surgery. (Row C) Pseudocolored images of the lateral half of the areas in Row B highlighting the nuclei detected through image processing in black. (Row D) Heatmaps of chondrocyte cell density for the areas in Row C ranging from yellow–highest cell density, to red–intermediate cell density, to dark blue–no cell density. Note the loss of viable chondrocytes in this region for the 4-week specimens.

