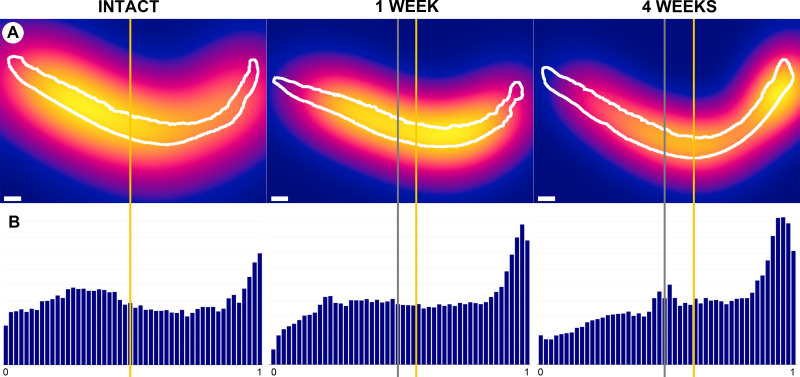
Fig 7. Medial femoral condyle articular cartilage demonstrates a shift in cell distribution away from areas articulating with the tibial spine at 1- and 4 weeks following surgical induction of posttraumatic OA.
The tibial spine is to the left for each image. (Row A) Heatmaps of chondrocyte cell density, ranging from yellow–highest cell density, to red–intermediate cell density, to dark blue–zero cell density. White bars indicate 1mm. (Row B) Histograms showing the relative frequency of nuclei by relative peripheral position from 0-notch to 1-peripheral. The gray lines indicate the center, and the yellow lines indicate the mean median peripheral chondrocyte position for each specimen. Note the lateral shift of the median cell position over time.

