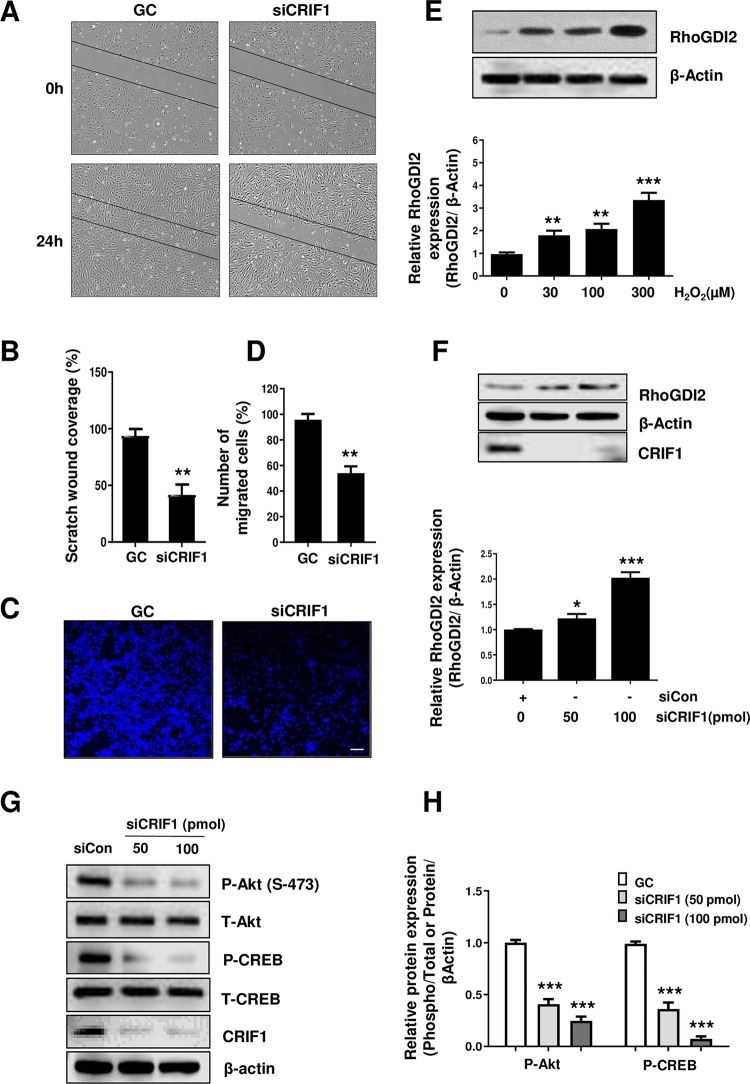
Fig 1. Effect of CRIF1 deficiency on cell migration and RhoGDI2 expression in endothelial cells.
(A) HUVECs were cultured in six-well plates, transfected with control or CRIF1 siRNA (100 pmol), and incubated for 24 h. Next, the cells were wounded for 24 h. Images were obtained using a light microscope. (B) Quantification of wound closure was performed using ImageJ software. (C) HUVECs were transfected with control or CRIF1 siRNA (100 pmol) and transwell assay was conducted to determine cell migration. Scale bar 200 μm. (D) Quantification of the number of migrated cells was performed using ImageJ software. (E) Western blot analysis of RhoGDI2 in HUVECs treated with the indicated doses of H2O2 for 24 h. β-actin was used as an internal control. RhoGDI2 protein level quantified by densitometric analysis using ImageJ software is shown in the down panel. (F) Western blot analysis of RhoGDI2 after 48 h of dose-dependent CRIF1 siRNA transfection. β-actin was used as an internal control. RhoGDI2 protein level quantified by densitometric analysis using ImageJ software is shown in the down panel. (G) Western blot of phospho-Akt and phospho-CREB levels in HUVECs after 48 h of CRIF1 siRNA transfection. β-actin was used as an internal control. (H) Protein levels were quantified by densitometric analysis using ImageJ software. Data are means ± SD of three independent experiments. *P < 0.05, **P < 0.01 and *** P < 0.001 relative to the control (n = 3 per group).

