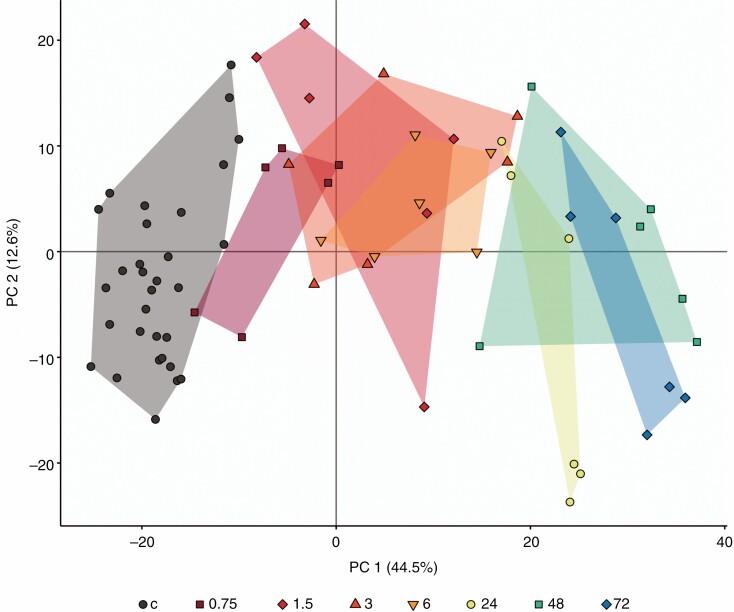
Fig. 1.
Ordination of the first two principle components from a PCA of metabolite profiles of D. capensis following insect substrate addition, with unfed controls. Treatments indicated are hours after substrate addition (c, unfed controls). Presented are the PC1 and PC2 scores for each plant, with convex hull colour for each treatment group. Different symbols represent each treatment time point. The presented PCA is without inclusion of the anomalous result (one control sample).

