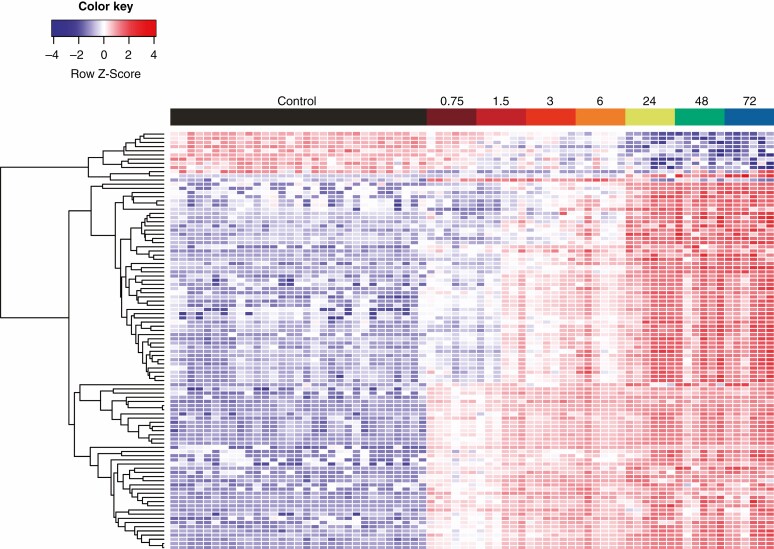
Fig. 3.
Metabolic patterns over time after prey substrate addition. Presented are the 100 most important features, based on statistical significance and fold change. Colour and colour intensity represent the Z score for the change in peak intensity from the mean of the compound (one compound per row). Each column represents a single plant; these are grouped according to treatment and harvest time point (randomly assigned within these). Each row represents a single metabolite grouped as a dendrogram by similarity in change of intensity.

