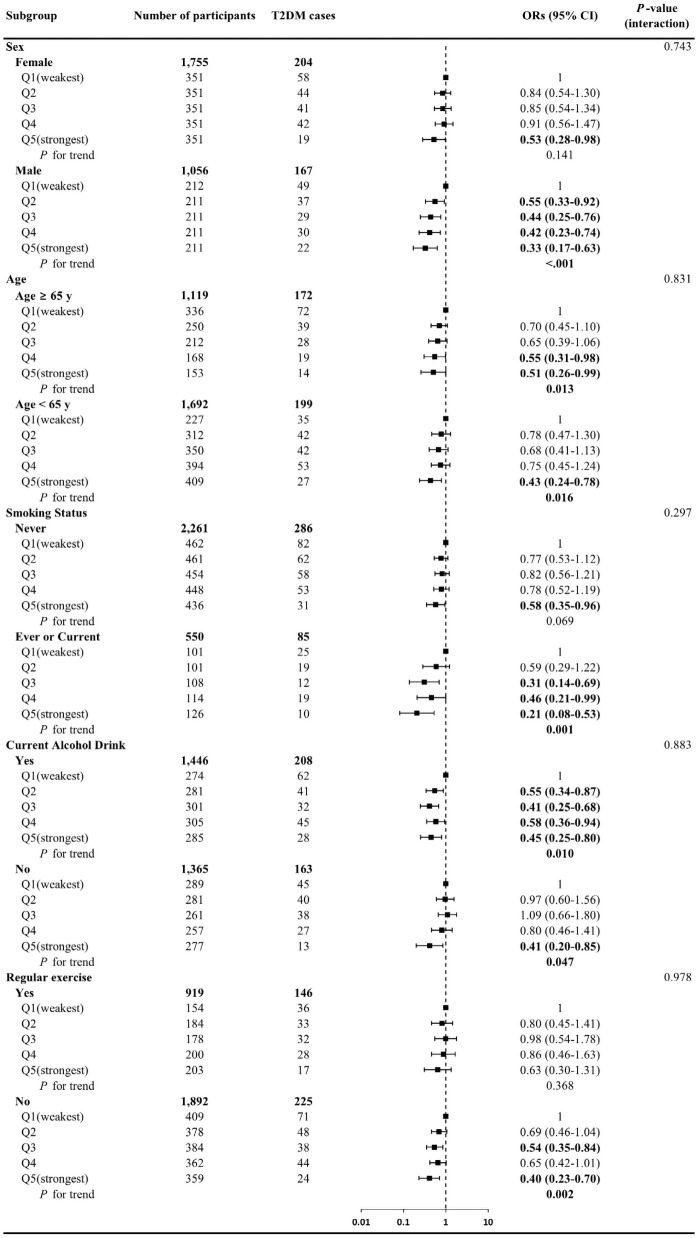
Fig 1. Odds ratios of T2DM by relative grip strength in stratified subgroup analyses.
Data presented as adjusted odds ratios (95% confidence intervals) across the quintiles of relative grip strength. Analyses were adjusted for sex (not in sex-stratified analyses), age (years, not in age-stratified analyses), smoking status (never, former, or current, not in smoking-stratified analyses), current alcohol drinking (yes or no, not in alcohol-stratified analyses), regular exercise (yes or no, not in regular exercise-stratified analyses), living with family (yes or no), ≥high school graduate (yes or no), family history of diabetes (yes or no), hypertension (yes or no), dyslipidemia (yes or no), and body mass index (kg/m2).

