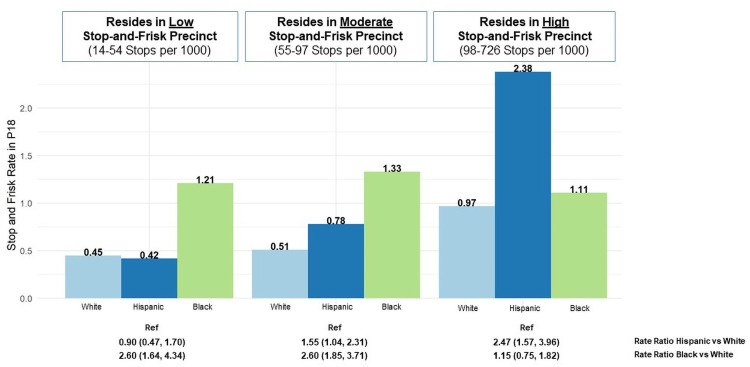
Fig 4. Race differences in past year stop-and-frisk rate among P18 participants at cohort baseline in 2014 by neighborhood-level stop-and-frisk rate (counts/1000)*.
*P18 participants were categorized according to their neighborhood-level stop-and-frisk rate, which were calculated as followed. Participant’s ZIP code was translated to latitude and longitude, which was then used to identify the New York City Police Department (NYPD) precinct in which the respondent lived (total of 77 possible precincts). NYPD precinct-level stop-and-frisk rates were calculated as the 2014 NYPD recorded number of stop-and-frisk events divided by the precinct population of male residents aged 20–29 years old; restricted given the younger age range of the P18 sample. The population estimates for New York City were calculated from 2014 estimates from the 2010–2014 5-year American Community Survey; population estimates for each census tract of New York City were calculated after restricting the sample to males aged 20–29 years. Each of the 77 precincts were categorized into group groups based on the precinct-level stop-and-frisk tertile. Within each tertile indicating neighborhood-level stop-and-frisk, stop-and-frisk rates were calculated at the race-specific number of stop-and-frisk events reported by P18 participants/race-specific P18 study population.

