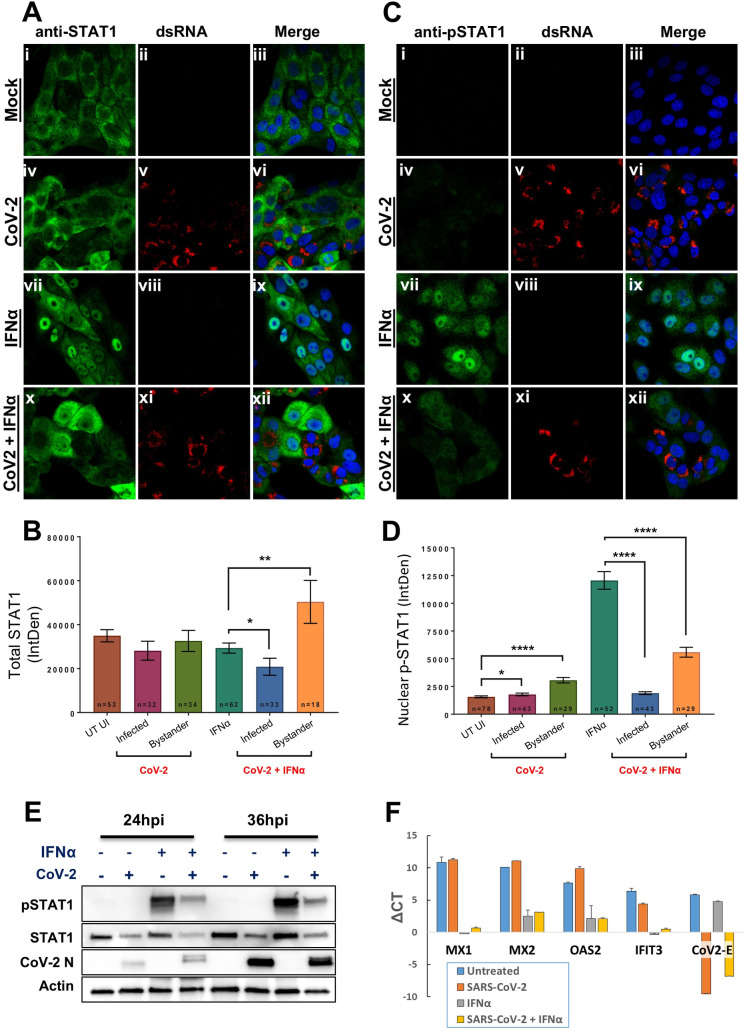
Fig 8. SARS-CoV-2 infection reduces total STAT1 levels and subsequent phosphorylation and nuclear translocation of STAT1.
Vero cells were infected with SARS-CoV-2 for 24 hours before IFNα was exogenously added for 30 minutes prior to analysis. (A) Immunofluorescence (IF) analysis of total STAT1 (green in panels i, iv, vii and x) in mock- (panels i-iii and vii-ix) and CoV-2-infected cells (panels iv-vi and x-xii) detected with anti-dsRNA antibodies (red in panels v and xi) in the absence (panels i-vi) or presence (panels vii-xii) of IFNα. (B) Quantification of total STAT1 (whole cell) assessed by IF analysis. Number of cells used are indicated from replicate experiments. Average measurement of fluorescence +/- SEM is depicted. Significance was assessed by students t-test: * p<0.05 and ** p<0.01. (C) and (D) Same analysis as described above for the detection of pSTAT1, except the quantitation depicts the amount of p-STAT1 observed within the nucleus. Average measurement of fluorescence +/- SEM is depicted. Significance was assessed by students t-test: * p<0.05 and **** p<0.0001. (E) Western blot depicting the abundance of both STAT1 and pSTAT1 in mock- and infected cells after exogenous addition of IFNα for 30 minutes. SARS-CoV-2 Infected cells were detected using anti-N antibodies and anti-actin antibodies served as a loading control. (F) qPCR of SARS-CoV-2 infected Vero cells. The data presented are expression levels normalized to housekeeping gene GAPDH (ΔCT). Results presented are means of three repeat experiments +/- SEM.

