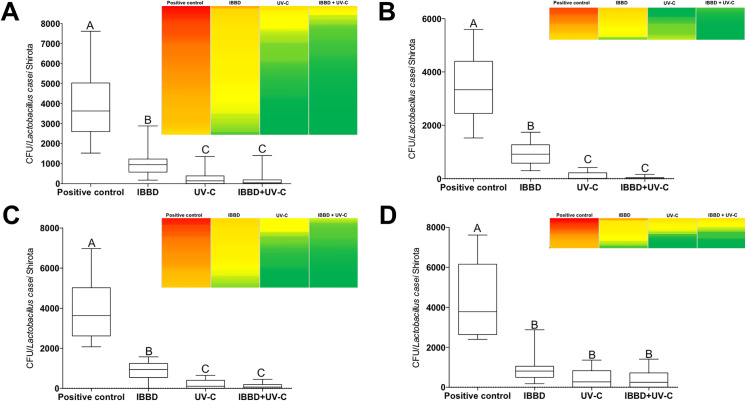
Fig 1. Box plot of the data of the CFU counts and a heat map of the dispersion of the counts of the plates on the different surfaces analyzed.
Data of all surfaces analyzed in a grouped manner (A); fluorescent lamp fixtures (B); in the stands (C) and on the floor (D). Different letters indicate statistical significance (p < 0.0001). One-way ANOVA and post hoc analysis using Tukey’s multiple comparation.

