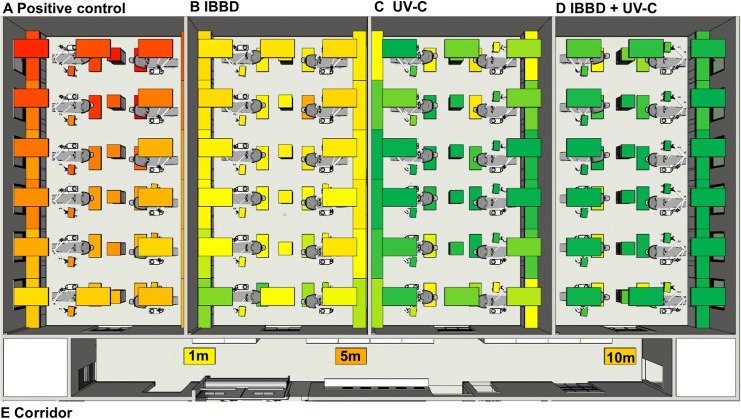
Fig 2.
Heat map of the results obtained from CFU counts in clinics: Positive Control (A); IBBD; UV-C; IBBD + UV-C and Corridor. The mean difference between the positive control group and the IBBD group was, on average, 75% (B). When using UV-C device, average CFU counts had, on average, a 93% (C) and 96% reduction in IBBD+UV-C (D). To evaluate the distance that PCDP can reach from the generating source, new Petri dishes were positioned in the corridor that connect the clinics to the end of the group test without barriers. It was observed the growth of CFU in the plates positioned 1m from the input, at 5m distance and 10 m away from the generating source (E).

