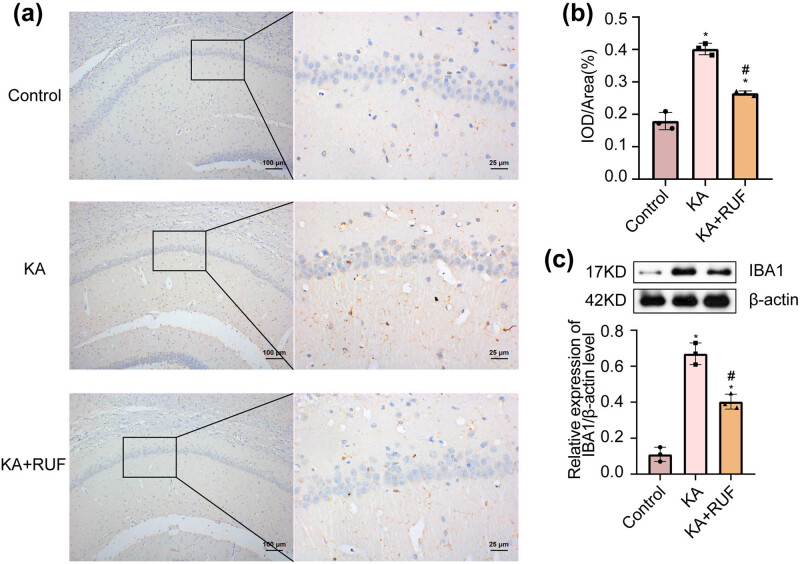
Figure 2.
Expression of microglia marker IBA-1 protein in mice. (a) IHC analysis of the expression of IBA-1 protein in mouse brain. (b) IHC analysis of the IOD/area of IBA-1 protein in mouse brain. (c) Western blot analysis of the relative expression of IBA-1 protein in mouse brain. (d) Cell viability was analyzed by CCK8. *Compared with control group, P < 0.05. #Compared with the KA group, P < 0.05. IOD: integrated optical density (brown = immunostaining, blue = nucleus).

