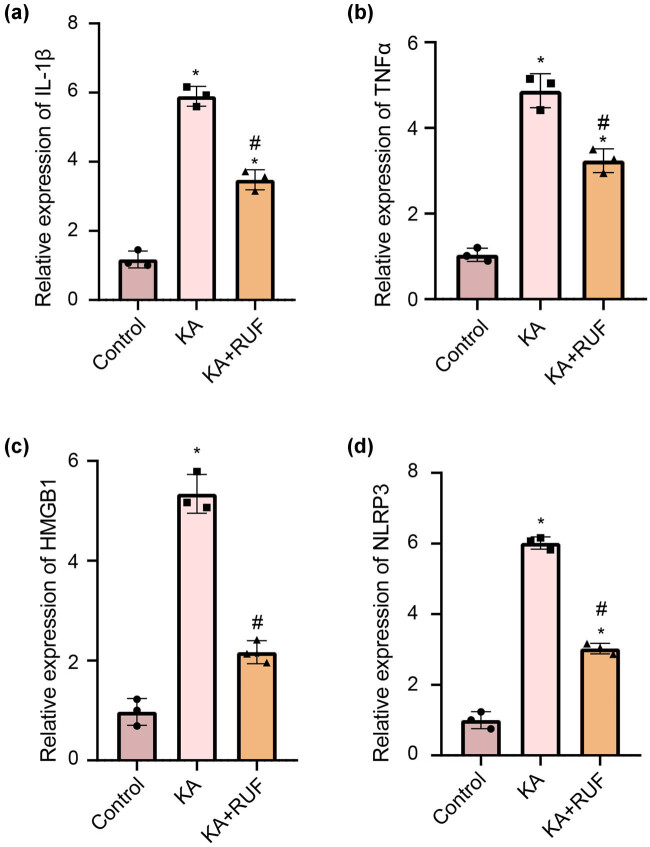
Figure 4.
RT-qPCR analysis of IL-1β, TNFα, HMGB1, and NLRP3 in mice. (a) The relative expression of IL-1β mRNA in different groups. (b) The relative expression of TNFα mRNA in different groups. (c) The relative expression of HMGB1 mRNA in different groups. (d) The relative expression of NLRP3 mRNA in different groups. *Compared with control group, P < 0.05. #Compared with the KA group, P < 0.05.

