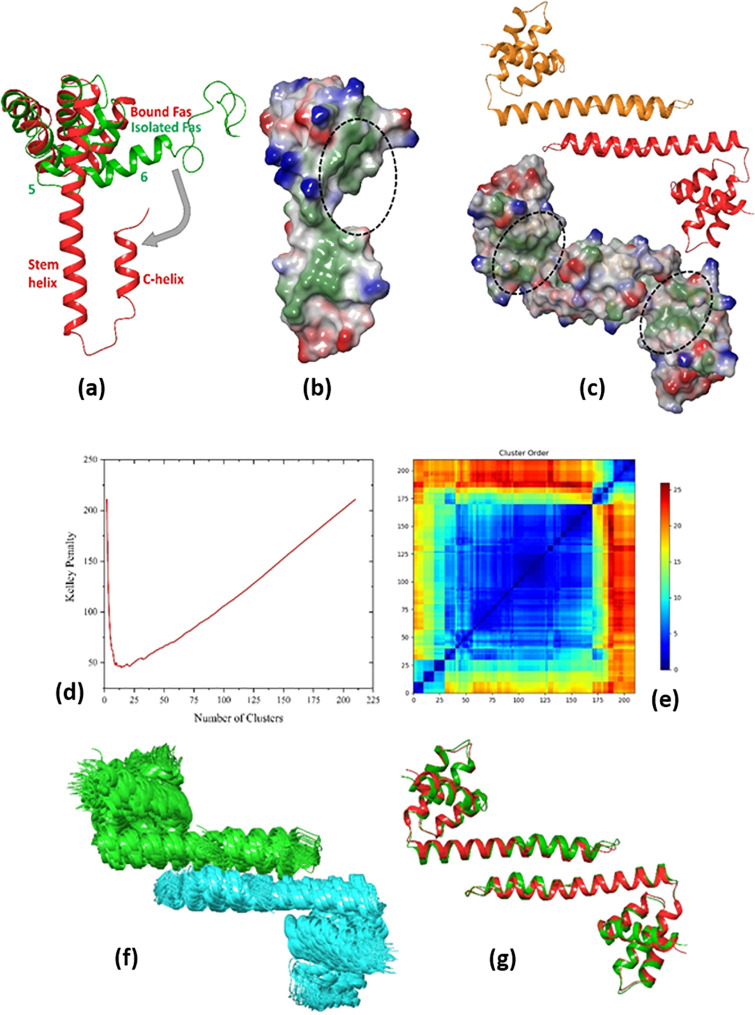
Figure 4.
(a) Conformational rearrangement from closed isolated FasDD (pdb-id: 1DDF, green) to open bound FasDD (pdb-id: 3EZQ, red). (b) FasDD opening discloses a hydrophobic patch that is the binding site of FADDDD, shown with dashed circles. (c) FasDD rearrangement allows for homodimerization of two open Fas molecules through interactions between their stem helices in a Fas–Fas bridge conformation. (d) Kelley penalty plot and (e) distance matrix from FasDD–FasDD clustering. (f) Most populated cluster with 83 members. Fas1,DD and Fas2,DD are presented in green and cyan colors, respectively. (g) Predicted complex (red) superposed on the crystal structure (green) (pdb-id: 3EZQ) with a Cα RMSD value of 1.1 Å.

