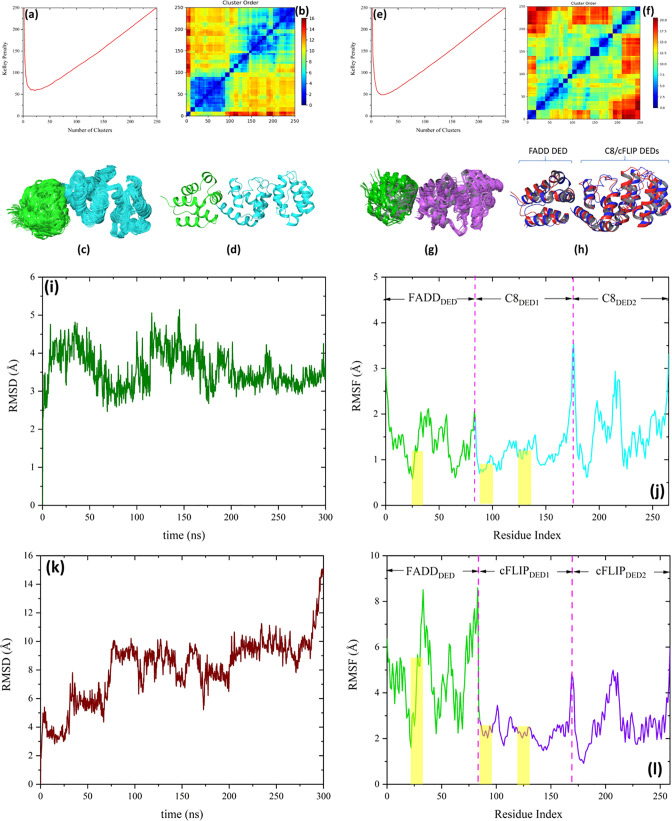
Figure 7.
(a) Kelley penalty plot and (b) distance matrix from FADDDED–C8DEDs docking. (c) Most populated cluster with 70 members and (d) the predicted complex based on the most populated cluster. FADDDED and C8DEDs are presented in green and cyan colors, respectively. (e) Kelley penalty plot and (f) distance matrix from FADDDED–cFLIPDEDs docking. (g) Most populated cluster with 30 members. FADDDED and cFLIPDEDs are presented in green and purple colors, respectively. (h) Predicted complex of FADDDED–cFLIPDEDs (red) superposed on the predicted complex of FADDDED–C8DEDs (blue) with the Cα RMSD value of 4.5 Å. (i) RMSD and (j) RMSF plots of FADDDED–C8DEDs and (k) RMSD and (l) RMSF plots FADDDED–cFLIPDEDs, during 300 ns MD simulation. The residues corresponding to each molecule engaged in the complex formation are shown in the RMSF panels. The yellow dashed areas in the RMSF plots show the interacting regions.

