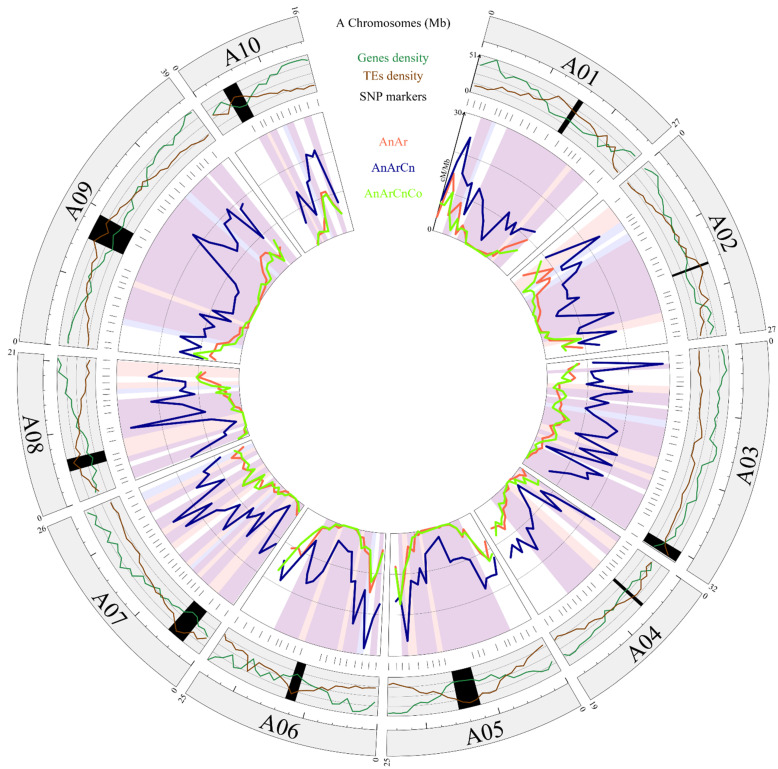
Figure 3.
Homologous recombination landscape in diploid, allotriploid and allotetraploid hybrids. The first circle represents the 10 chromosomes of B. rapa cv. Chiifu v1.5. Within the second circle, the gene and transposable element (TE) densities along each A chromosome are mentioned, with black rectangles indicating the putative centromere positions [53]. In the inner circle, the recombination rates (cM/Mb) of AnAr (2x), AnArCn (3x) and AnArCnCo (4x) are shown as red, blue and green lines, respectively. Significant differences within an interval are highlighted in peach, light blue and purple for 2x vs. 3x, 4x vs. 3x, or 4x and 2x vs. 3x, respectively. Above the recombination landscape, the physical position of each polymorph SNP used for these comparisons is indicated.

