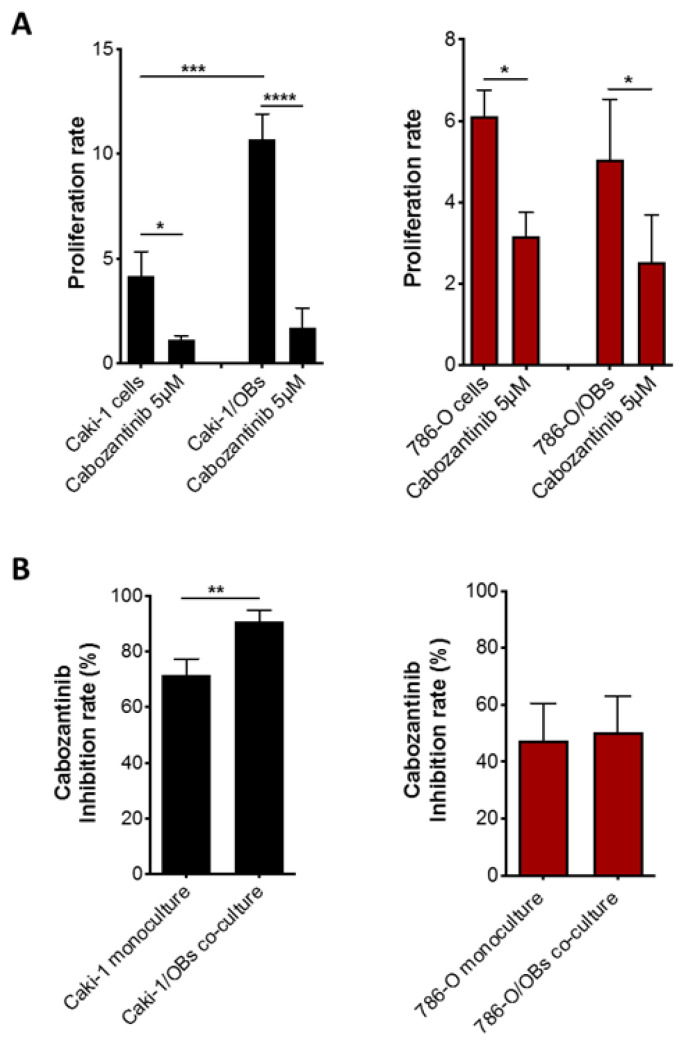
Figure 4.
Antitumor effect of cabozantinib in the RCC bone microenvironment. Proliferation (A) and inhibition rates (B) of Caki-1 GFP+ (left panels) and 786-O GFP+ (right panels) cells after a cabozantinib treatment (5 μM) in a monoculture or cocultured with OBs. Data are expressed as the mean ± SD; * p ≤ 0.05, ** p < 0.01, *** p < 0.001 and **** p < 0.0001.

