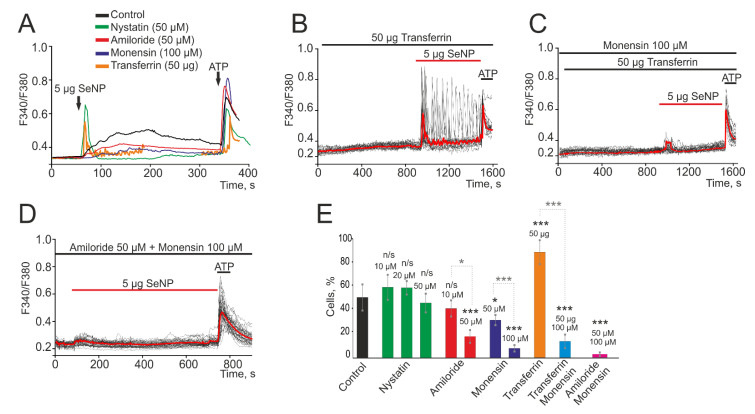
Figure 2.
Contribution of micropinocytosis, caveolar, and clathrin-associated endocytosis to the generation of Ca2+ signals in A-172 cells upon application of 5 µg/mL SeNP. (A) Average values of Ca2+ signals caused by the application of 5 µg/mL SeNP over several tens of cells in the control (black curve) and after 2 h incubation of cells with a blocker of caveolar endocytosis (green curve, Nystatin, 50 µM), micropinocytosis (red curve, Amiloride, 50 µM), and clathrin-associated endocytosis (purple curve, Monensin, 100 µM). The potentiating effect of a receptor-mediated clathrin-associated endocytosis activator, Transferrin (orange curve, 50 µM), on Ca2+ signals upon SeNP application. (B) Application of SeNP after incubation with Transferrin tends to increase the amplitude of Ca2+ signals. (C) The blockade of clathrin-associated endocytosis with Monensin reverses the potentiating effect of Transferrin on Ca2+ signals upon application of SeNP. (D) Complete suppression of Ca2+ signals in cells in response to the application of 5 µg/mL SeNPs after simultaneous inhibition of micropinocytosis and clathrin-associated endocytosis. At the end of the experiment, 10 μM adenosine triphosphate (ATP) was added. (E) The number of cells in percentage ratio, reacting with Ca2+ signals upon application of 5 µg/mL SeNPs during inhibition of various types of endocytosis or activation of a receptor-mediated clathrin-associated endocytosis. The differences between the control and experimental groups are marked with asterisks—* p < 0.05 and *** p < 0.001. n/s—differences insignificant.

