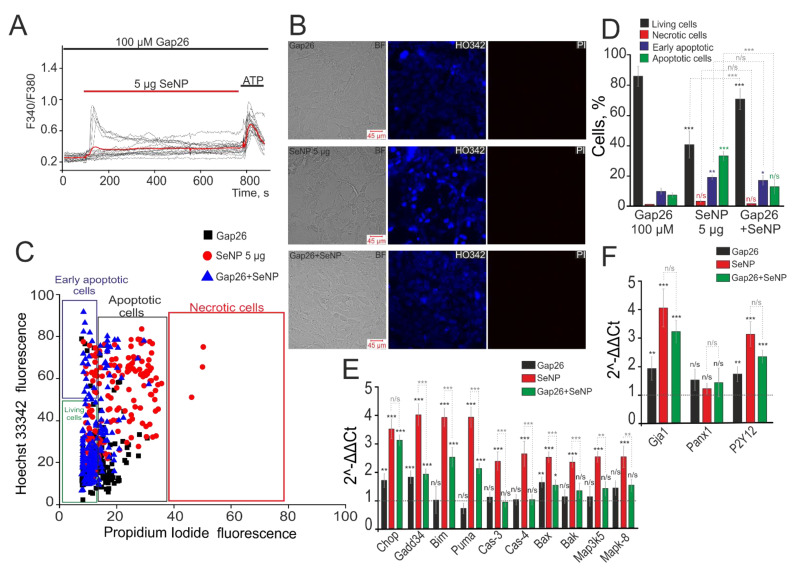
Figure 7.
Inhibition of Cx43 suppresses the induction of apoptosis in A-172 cells induced by the application of 5 µg/mL SeNP. (A) Suppression of Ca2+ signals in 87 ± 11% of cells after incubation with 100 μM Gap26 for 30 min and subsequent incubation with 5 μg/mL SeNP for 24 h. (B) Identification of cells in the early and late stages of apoptosis or necrosis after incubating with 100 µM Gap26 and 5 μg/mL SeNP separately and together. (C) Cytogram demonstrating the viability of A-172 cells. X-axis—the intensity of PI fluorescence; Y-axis—the intensity of Hoechst 33,342 fluorescence. (D) The number of cells in the percentage ratio that are in the early (violet column) or late stages (green column) of apoptosis or necrosis (red column) and living cells (black column). (E,F) Real-time PCR results showing changes in mRNA expression of the main pro-apoptotic genes (E) and genes encoding receptors (F) in response to treatment of A-172 cells with 100 µM Gap26 (black columns), 5 μg/mL SeNP (red columns), and Gap26+SeNP (green columns). The horizontal line corresponds to the expression of mRNA of the studied genes in control samples (without some compounds application). The differences are marked with asterisks—* p < 0.05, ** p < 0.01, and *** p < 0.001. n/s—differences insignificant.

