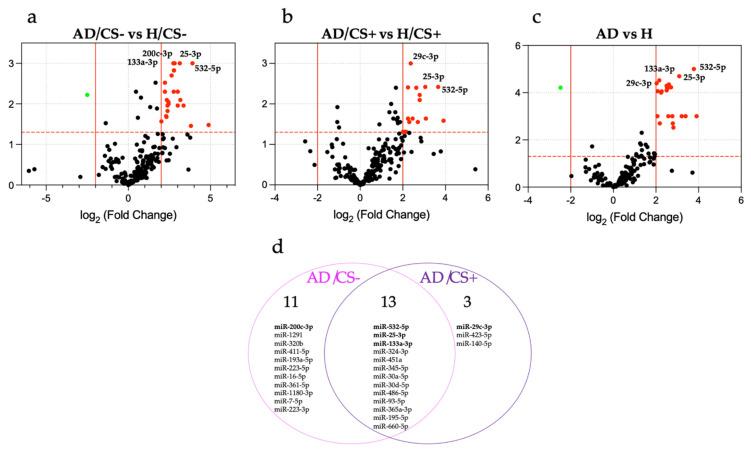
Figure 1.
Analysis of the differentially expressed miRNAs in AD patients according to cigarette-smoking status, identified in the discovery phase. Volcano plots of the miRNA profiles (a) AD/CS− compared with H/CS−, (b) AD/CS+ compared with H/CS+, (c) AD compared with H. The red dots represent differential upregulation of miRNAs (p < 0.05 and log2Fold Change > 2), and the green dots represent differential downregulation of miRNAs (p < 0.05 and log2Fold Change < −2). (d) Venn diagram analysis of the differentially expressed miRNAs in AD patients according to cigarette-smoking status. AD, adenocarcinoma; CS, cigarette smoking; H, healthy controls.

