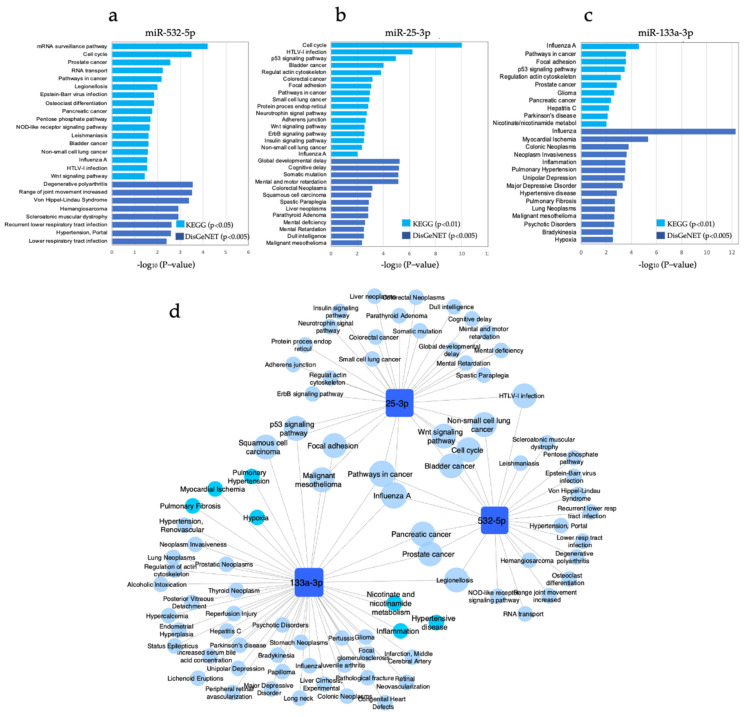
Figure 4.
Pathway enrichment analysis of miR-532-5p, miR-25-3p and miR-133a-3p. (a–c) The figure shows the top significantly enriched pathways (KEGG, p < 0.01; and DisGeNET, p < 0.005) regulated by experimentally validated genes targeted by miR-532-5p, miR-25-3p and miR-133a-3p. (d) The network of the miRNAs and their significantly enriched pathways. The miRNAs are displayed as blue squares, and pathways are displayed as light blue circles. The size corresponds to the number of interactions between pathways and the miRNAs. Pathways associated with inflammation and smoking-associated diseases are highlighted with bright blue color. Cytoscape v3.1.0 was used for network visualization.

