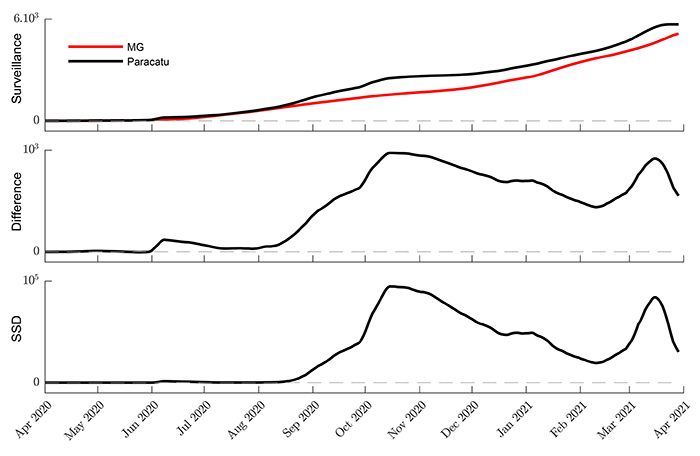
Figure 3. Details of signed squared difference (SSD) time series construction. The SSD was developed to show the evolution of municipality data in relation to the state, considered as a reference curve. The figure shows both the difference and the SSD time series. The difference signal can be considered a detrended time series (in relation to state time series). The SSD time series was used to spotlight when the surveillance data of one municipality deviated from the reference.

