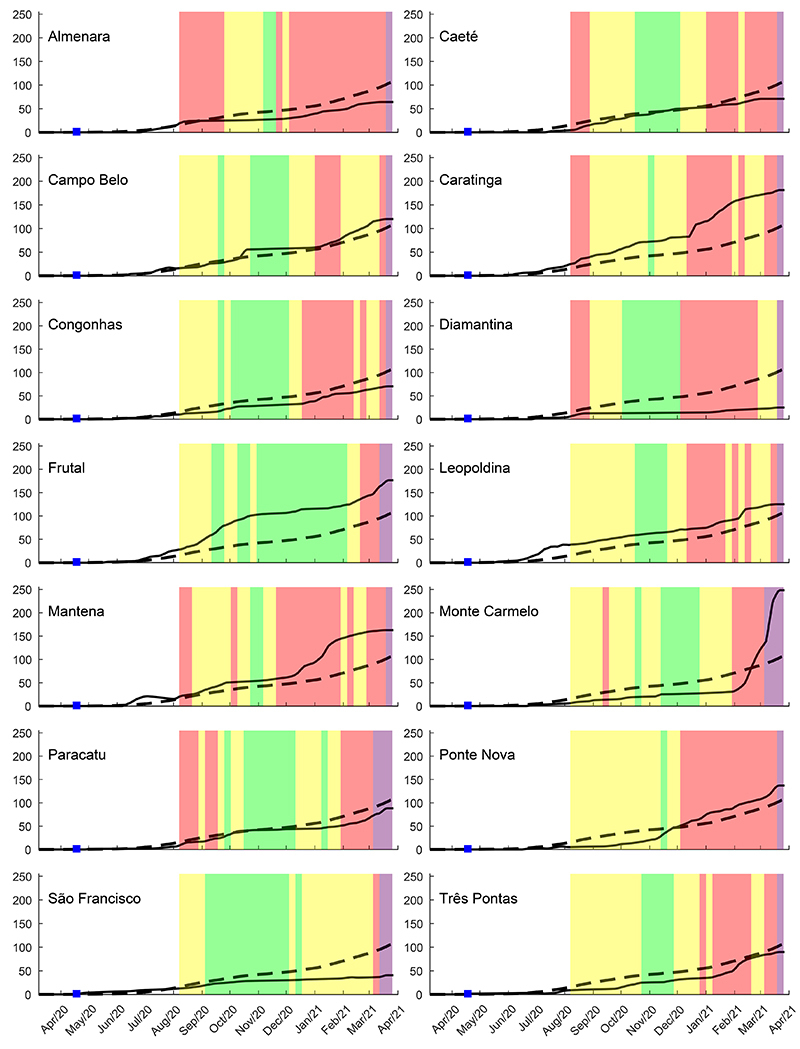
Figure 6. Deaths resulting from COVID-19 (per 100k inhabitants) for the 14 municipalities of Minas Gerais (MG) state macro-regions (full lines) compared with the whole MG state (segmented lines). The colored bands from August 2020 to March 2021 represent the color wave codes defined by the Conscious Minas Plan. The first confirmed case within each macro-region is shown as a blue square mark.

