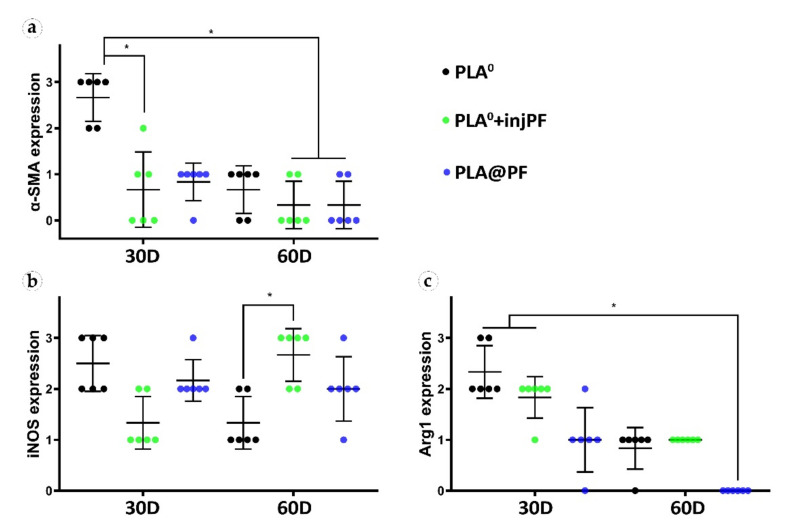
Figure 10.
Semi-quantitative scoring analysis of the expression of immunohistochemical markers in PIC examined by the intensity of staining (see Table 1 for the criteria): (a) α-SMA, (b) iNOS, and (c) Arg1. The results are presented as scatterplots, Mean ± SD, * p ≤ 0.05.

