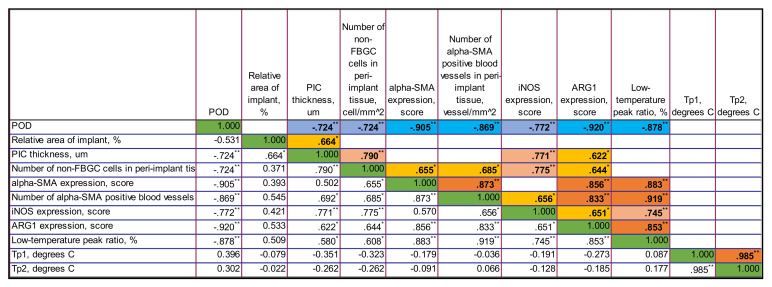
Figure A4.
The correlation matrix for PLA0 group. Only statistically significant values of Rs are shown in the upper part of the matrix. The color highlights indicate the sign and the strength of the correlation. The tones of blue color show negative correlation, and the ones of orange show the positive correlations. The intensity of the tone reflects the strength of the correlation. The diagonal series of green cells indicates the self-correlation of the same-named variables. ** Correlation is significant at the 0.01 level (2-tailed). * Correlation is significant at the 0.05 level (2-tailed).

