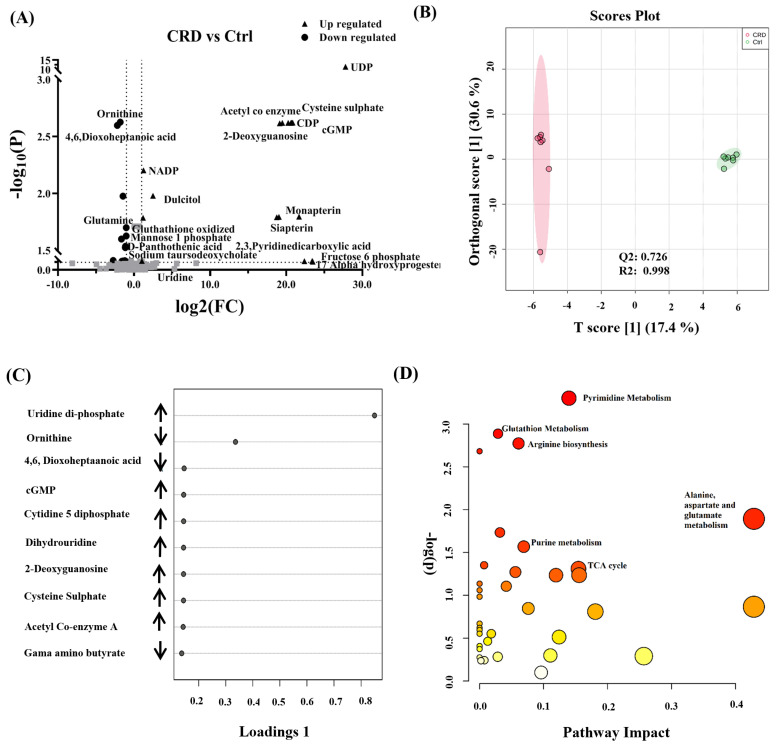
Figure 2.
Binary comparison and pathway analysis in DBS of patients with cystic renal diseases (CRD). (A) Dysregulated metabolites between CRD vs. Ctrl with fold change cut-off 2 (up-regulated (n = 17) down-regulated (n = 15)) based on all detected features (B) Orthogonal partial least square discriminant analysis (OPLS-DA) score plot shows apparent clustering and separation, due to the biological differences between patients with CRD (n = 7) and healthy Ctrl (n = 7) (R2 = 0.998 and Q2 = 0.726) that represents the level of global metabolic differential expression (sample run in duplicates). (C) Loading plot shows the regulation of metabolic expression of metabolites in CRD compared to the Ctrl group. (D) Pathway analysis shows significantly altered amino acid metabolism and purine and pyrimidine, glutathione, and TCA cycle pathways. (color-coded and the circle’s size reflect the combination between the p-value and the pathway impact, respectively.).

