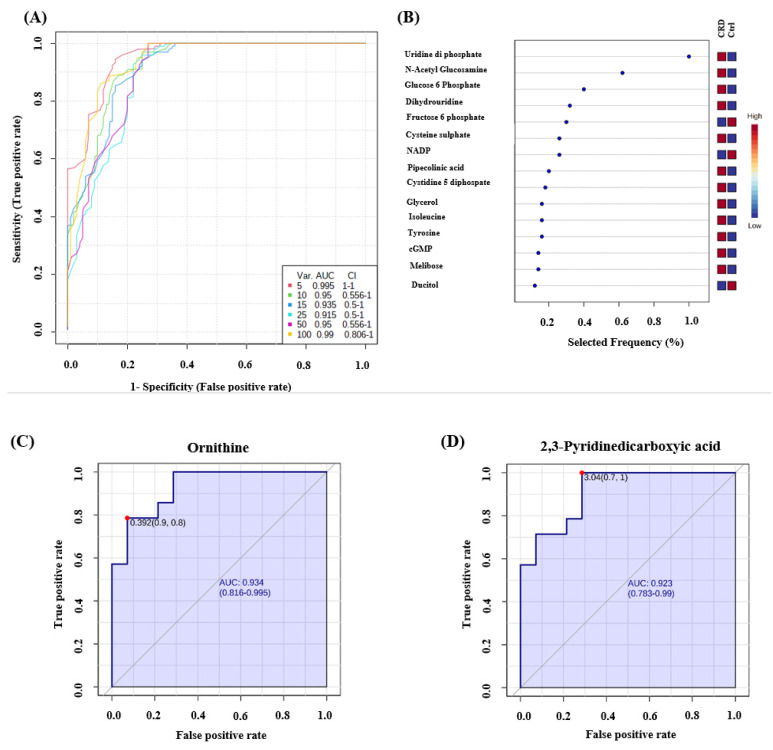
Figure 4.
Receiver operating characteristics (ROC) curve and loading plots for significant metabolites in DBS of patients with cystic renal diseases. (A) ROC was generated by PLS-DA model showing area under the curve (AUC) for the top five variants = 0.995. (B) Frequency percentage plot of the dysregulated metabolites in CRD patients when compared to the controls. (C) Ornithine (AUC-0.934) and (D) 2,3-Pyridinedicarboxyic acid (AUC-0.923) were down regulated in CRD patients Data were normalized, transformed, and scaled by median, log, and Pareto scaling to make sure all the data are under Gaussian distribution.

