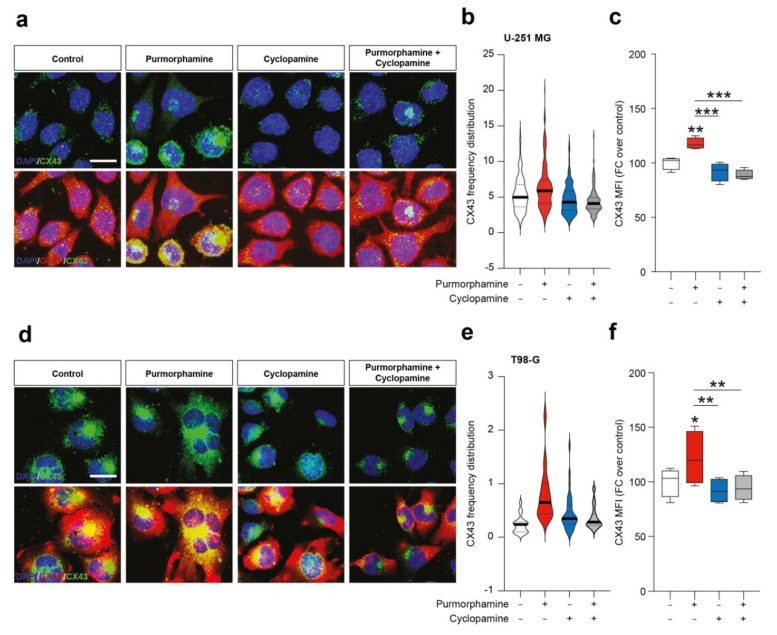
Figure 3.
SHH pathway activation increase immunofluorescence intensity of CX43 in human GBM cell lines. (a–c) Representative microphotographs of CX43 and GFAP (a), CX43 frequency distribution (b) and quantification of CX43 MFI (c) of control human U-251 MG cells and U-251 MG cells exposed to 1 µM of purmorphamine and/or cyclopamine. (d–f) Representative pictures of CX43 and GFAP (d), CX43 frequency distribution (e) and quantification of CX43 MFI (f) of control human T98-G cells and T98-G cells exposed to 1 µM of purmorphamine and/or cyclopamine. Data in (b,e) are shown as violin plot of n ≥ 20 cells and data in (c,f) are shown via standard box and whiskers plot of n = 4 independent experiments; * p-value < 0.05, ** p-value < 0.01, *** p-value < 0.001 versus control or between groups; one-way ANOVA with Holm–Šídák post-hoc test. In (a,d) nuclei were counterstained with DAPI; scale bar in (a,d) = 10 μm. MFI.

