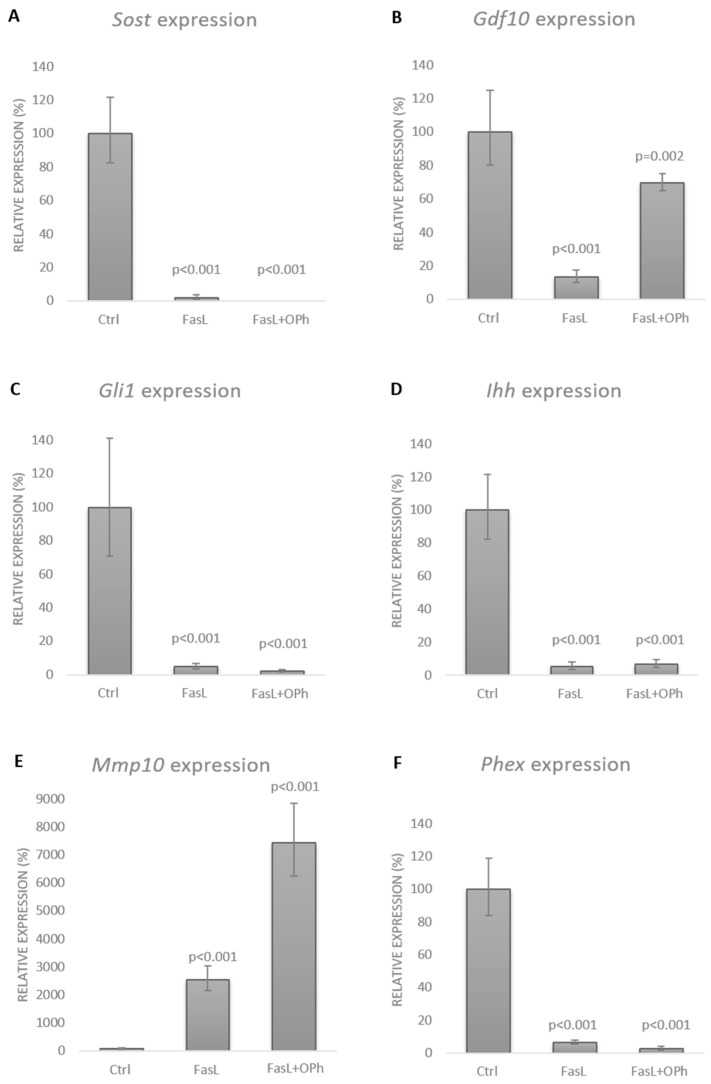
Figure 4.
Expression of Sost (A), Gdf10 (B), Gli1 (C), Ihh (D), Mmp10 (E), and Phex (F) in the differentiated IDG-SW3 cells after FasL stimulation with (FasL + OPh) and without (FasL) caspase inhibition. Expression levels were compared with those in the untreated controls. The results are shown in %, indicating the mean ± standard deviation of three replicates (expression in the control cells was set to 100%).

