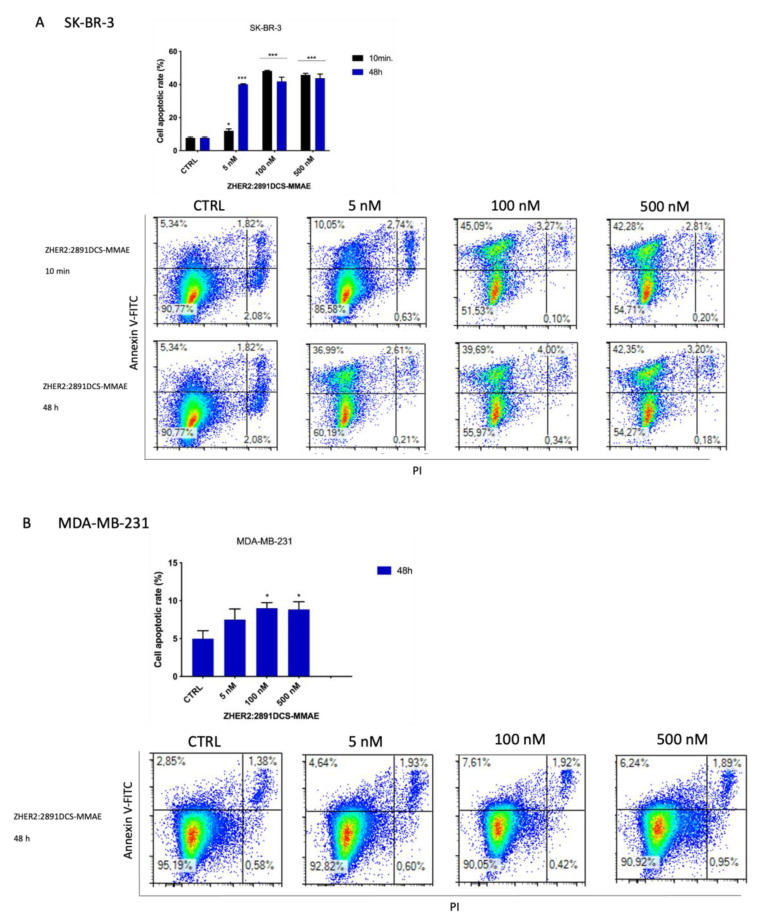
Figure 7.
Detection of cell death induced by ZHER2:2891DCS-MMAE and trastuzumab treatments. The effect of cellular death induced by ZHER2:2891DCS-MMAE and trastuzumab was tested in SK-BR-3 (A,C) and MDA-MB-231 cells (B) by flow cytometry. The top left quadrant represents the percentage of early apoptotic cells (Annexin V+/PI−), the top right quadrant is the percentage of late apoptotic cells (Annexin V+/PI+); whereas the bottom left quadrant represents the percentage of live cells (Annexin V−/PI−) and the bottom right quadrant represents the percentage of necrotic cells (Annexin V+/PI+). Cells were treated with the substances for 10 min followed by drug removal and an additional 48 h of incubation in medium alone (black bar) or for 48 h of continuous exposure to treatments (blue bar). The p-value was determined by one-way ANOVA test with Dunnett post hoc test and considered significant for p < 0.05 *, p < 0.001 *** compared to the control. Data are presented as mean ± SEM.


