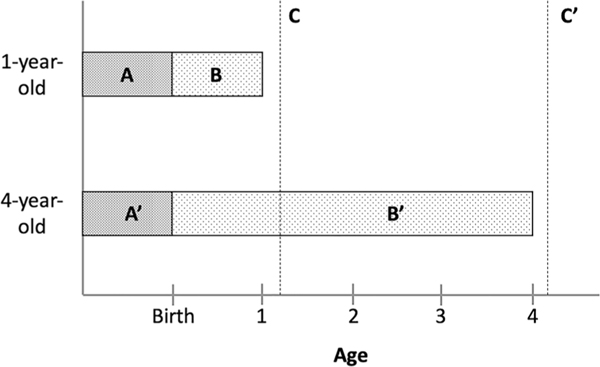
Fig. 1.
Climate anomaly exposures for two example children ages 1 and 4 years. Period A and A′ represent prenatal climate anomalies, while B and B′ represent postnatal climate anomalies for 1- and 4-year-olds, respectively. C and C′ represent the point at which height measurements were taken on corresponding DHS survey dates

