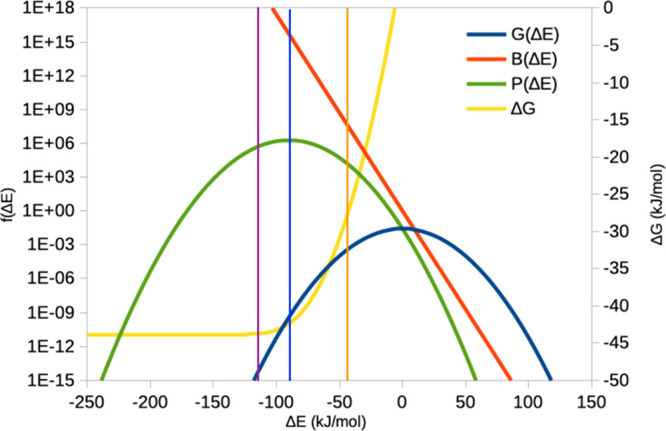
Figure 5.

Problem of converging
the exponential average. Assuming that ΔE follows
a Gaussian distribution, the exponential average
can be rewritten as an integral over the product of two terms  , the Gaussian distribution
  and the Boltzmann factor
  .30 These two
terms are shown in the figure for the example of σIE = 15 kJ/mol (note the logarithmic scale). In this case, the maximum
for the product is attained at ΔE = 90 kJ/mol
(blue vertical line). At this value, G = 4 ×
10–10 (but B = 5 × 10¹⁵), so around 1010 snapshots are needed before
this value is observed. In fact, ΔG and therefore
ΔS (which is ΔG minus
the average of ΔE) are still not fully converged
(ΔG in the figure; right axis; it should be
read from the right to the left, i.e., showing ΔG when all values larger than ΔE are included),
differing by 1.4 kJ/mol from the analytic result; convergence to within
0.1 kJ/mol is obtained at ΔE = −115
kJ/mol, when G = 5 × 10–15 (violet vertical line). If all ΔE < 3σIE (= −45 kJ/mol) are ignored, ΔG and TΔS will be wrong by
over 15 kJ/mol (orange vertical line) because the most important parts
of P are excluded.
