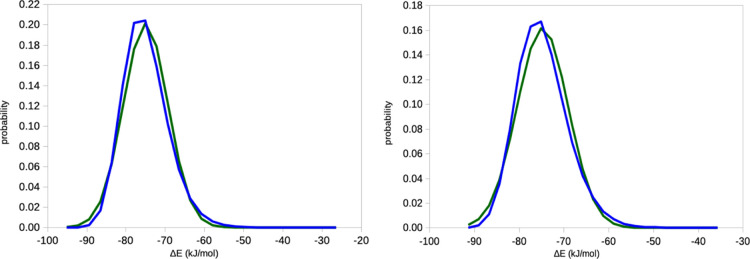
Figure 8.
Distribution of the ΔEIE energies for the binding of benzene to T4 lysozyme, estimated from 10 × 10 ns simulations with a sampling frequency of 10 fs (left) 10 × 100 ns simulations with a sampling of 10 ps (right). The green curve shows the ideal Gaussian distribution with the same average and standard deviation.

